Cmb.Tech (ENXTBR:CMBT) stock is catching investors’ attention today as recent trading patterns point to shifts in sentiment. Shares have seen mixed returns lately, bringing valuation and future prospects into sharper focus for the market.
While Cmb.Tech’s share price ticked higher over the past quarter, overall momentum has cooled, with a recent one-year total shareholder return of -41.5%. Investors seem to be weighing past volatility against the company’s longer-term growth and valuation prospects.
With Cmb.Tech shares now trading nearly 29 percent below analyst price targets, along with recent profit and revenue growth, investors must consider whether the discount signals true undervaluation or if the market already anticipates future gains.
Advertisement
Price-to-Earnings of 11.3x: Is it justified?
Cmb.Tech is currently trading at a price-to-earnings (P/E) ratio of 11.3x, which is lower than both its peer group average of 13.9x and the broader European Oil and Gas industry average of 14.5x. This suggests that the market may be undervaluing Cmb.Tech's earnings relative to those of its industry peers.
The P/E ratio measures what investors are willing to pay today for a dollar of expected future earnings. It is a core valuation metric in established industries like oil and gas, where earnings serve as a proxy for underlying business health and market sentiment. A comparatively lower ratio like Cmb.Tech’s could reflect skepticism about future earnings growth, recent volatility, or even overlooked potential by the market.
Notably, this discount to peer multiples stands out given Cmb.Tech's revenue and profit growth forecasts. If the company delivers on these growth expectations, the current P/E could be compelling. However, with profit margin pressures and recent share price volatility, the market may be pricing in execution risks. In the absence of a fair ratio comparison from regression analysis, investors should be alert to the potential for the valuation gap to narrow if sentiment shifts.
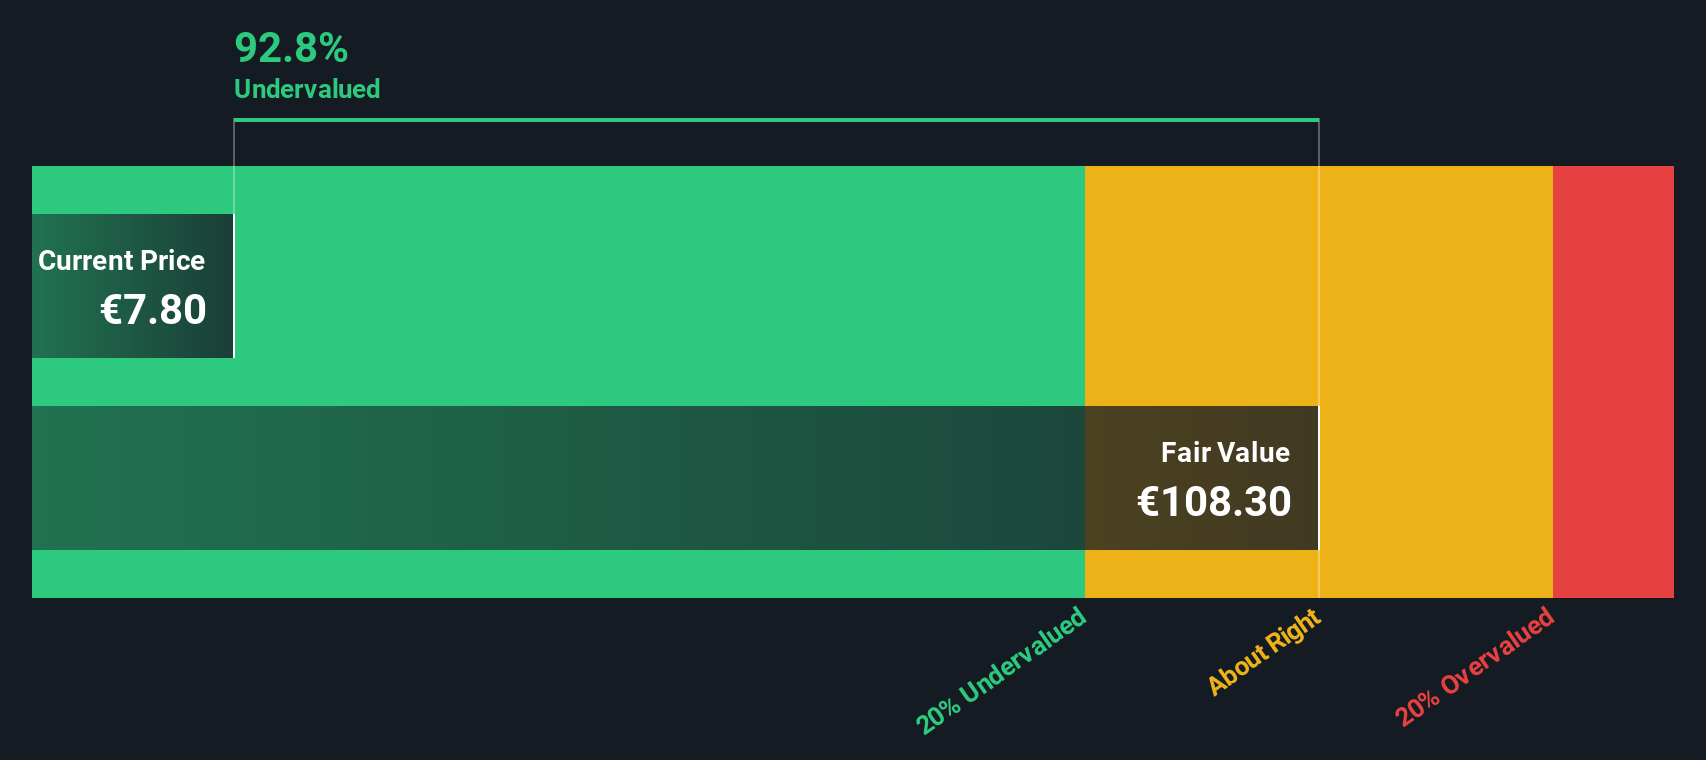
The SWS DCF model offers a strikingly different perspective, suggesting Cmb.Tech may be massively undervalued. It estimates fair value at €110.85, far above the current share price of €8.15. Does this huge gap represent a rare bargain, or is the model too optimistic?
Simply Wall St performs a discounted cash flow (DCF) on every stock in the world every day (check out Cmb.Tech for example). We show the entire calculation in full. You can track the result in your watchlist or portfolio and be alerted when this changes, or use our stock screener to discover undervalued stocks based on their cash flows. If you save a screener we even alert you when new companies match - so you never miss a potential opportunity.
Build Your Own Cmb.Tech Narrative
If you see things differently or want to build your own perspective on Cmb.Tech, you can run your own analysis in just a few minutes. Do it your way.
Smart investors constantly scan the horizon for unique opportunities. Take your next step with Simply Wall Street’s screener, and you might just uncover your next top performer before everyone else does.
Tap into tomorrow’s breakthroughs by finding exciting prospects in these 27 AI penny stocks built around cutting-edge artificial intelligence innovation.
This article by Simply Wall St is general in nature. We provide commentary based on historical data
and analyst forecasts only using an unbiased methodology and our articles are not intended to be financial advice. It does not constitute a recommendation to buy or sell any stock, and does not take account of your objectives, or your
financial situation. We aim to bring you long-term focused analysis driven by fundamental data.
Note that our analysis may not factor in the latest price-sensitive company announcements or qualitative material.
Simply Wall St has no position in any stocks mentioned.
New: AI Stock Screener & Alerts
Our new AI Stock Screener scans the market every day to uncover opportunities.
• Dividend Powerhouses (3%+ Yield) • Undervalued Small Caps with Insider Buying • High growth Tech and AI Companies