These 4 Measures Indicate That Wiseway Group (ASX:WWG) Is Using Debt In A Risky Way

The external fund manager backed by Berkshire Hathaway's Charlie Munger, Li Lu, makes no bones about it when he says 'The biggest investment risk is not the volatility of prices, but whether you will suffer a permanent loss of capital.' It's only natural to consider a company's balance sheet when you examine how risky it is, since debt is often involved when a business collapses. Importantly, Wiseway Group Limited (ASX:WWG) does carry debt. But the more important question is: how much risk is that debt creating?
Why Does Debt Bring Risk?
Generally speaking, debt only becomes a real problem when a company can't easily pay it off, either by raising capital or with its own cash flow. If things get really bad, the lenders can take control of the business. However, a more frequent (but still costly) occurrence is where a company must issue shares at bargain-basement prices, permanently diluting shareholders, just to shore up its balance sheet. Having said that, the most common situation is where a company manages its debt reasonably well - and to its own advantage. When we think about a company's use of debt, we first look at cash and debt together.
View our latest analysis for Wiseway Group
What Is Wiseway Group's Debt?
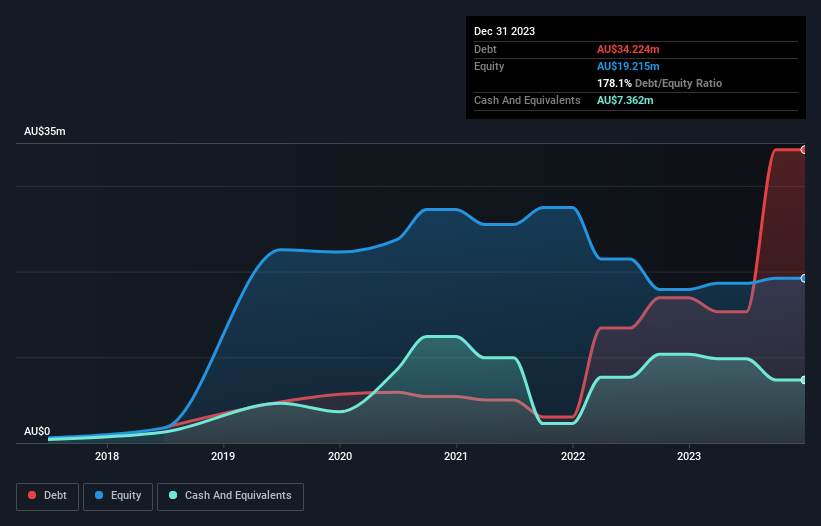
You can click the graphic below for the historical numbers, but it shows that as of December 2023 Wiseway Group had AU$34.2m of debt, an increase on AU$16.9m, over one year. On the flip side, it has AU$7.36m in cash leading to net debt of about AU$26.9m.
How Healthy Is Wiseway Group's Balance Sheet?
According to the last reported balance sheet, Wiseway Group had liabilities of AU$19.0m due within 12 months, and liabilities of AU$28.7m due beyond 12 months. On the other hand, it had cash of AU$7.36m and AU$15.2m worth of receivables due within a year. So its liabilities outweigh the sum of its cash and (near-term) receivables by AU$25.1m.
The deficiency here weighs heavily on the AU$10.0m company itself, as if a child were struggling under the weight of an enormous back-pack full of books, his sports gear, and a trumpet. So we definitely think shareholders need to watch this one closely. At the end of the day, Wiseway Group would probably need a major re-capitalization if its creditors were to demand repayment.
In order to size up a company's debt relative to its earnings, we calculate its net debt divided by its earnings before interest, tax, depreciation, and amortization (EBITDA) and its earnings before interest and tax (EBIT) divided by its interest expense (its interest cover). The advantage of this approach is that we take into account both the absolute quantum of debt (with net debt to EBITDA) and the actual interest expenses associated with that debt (with its interest cover ratio).
Weak interest cover of 1.1 times and a disturbingly high net debt to EBITDA ratio of 8.3 hit our confidence in Wiseway Group like a one-two punch to the gut. This means we'd consider it to have a heavy debt load. However, the silver lining was that Wiseway Group achieved a positive EBIT of AU$2.1m in the last twelve months, an improvement on the prior year's loss. The balance sheet is clearly the area to focus on when you are analysing debt. But you can't view debt in total isolation; since Wiseway Group will need earnings to service that debt. So when considering debt, it's definitely worth looking at the earnings trend. Click here for an interactive snapshot.
Finally, while the tax-man may adore accounting profits, lenders only accept cold hard cash. So it's worth checking how much of the earnings before interest and tax (EBIT) is backed by free cash flow. Looking at the most recent year, Wiseway Group recorded free cash flow of 23% of its EBIT, which is weaker than we'd expect. That weak cash conversion makes it more difficult to handle indebtedness.
Our View
To be frank both Wiseway Group's interest cover and its track record of staying on top of its total liabilities make us rather uncomfortable with its debt levels. But at least its EBIT growth rate is not so bad. Taking into account all the aforementioned factors, it looks like Wiseway Group has too much debt. That sort of riskiness is ok for some, but it certainly doesn't float our boat. The balance sheet is clearly the area to focus on when you are analysing debt. But ultimately, every company can contain risks that exist outside of the balance sheet. These risks can be hard to spot. Every company has them, and we've spotted 3 warning signs for Wiseway Group you should know about.
If, after all that, you're more interested in a fast growing company with a rock-solid balance sheet, then check out our list of net cash growth stocks without delay.
The New Payments ETF Is Live on NASDAQ:
Money is moving to real-time rails, and a newly listed ETF now gives investors direct exposure. Fast settlement. Institutional custody. Simple access.
Explore how this launch could reshape portfolios
Sponsored ContentValuation is complex, but we're here to simplify it.
Discover if Wiseway Group might be undervalued or overvalued with our detailed analysis, featuring fair value estimates, potential risks, dividends, insider trades, and its financial condition.
Access Free AnalysisHave feedback on this article? Concerned about the content? Get in touch with us directly. Alternatively, email editorial-team (at) simplywallst.com.
This article by Simply Wall St is general in nature. We provide commentary based on historical data and analyst forecasts only using an unbiased methodology and our articles are not intended to be financial advice. It does not constitute a recommendation to buy or sell any stock, and does not take account of your objectives, or your financial situation. We aim to bring you long-term focused analysis driven by fundamental data. Note that our analysis may not factor in the latest price-sensitive company announcements or qualitative material. Simply Wall St has no position in any stocks mentioned.
About ASX:WWG
Wiseway Group
Provides logistics and freight forwarding services in Australia, New Zealand, China, Singapore, and the United States.
Outstanding track record with excellent balance sheet.
Similar Companies
Market Insights

Weekly Picks

Early mover in a fast growing industry. Likely to experience share price volatility as they scale


A case for CA$31.80 (undiluted), aka 8,616% upside from CA$0.37 (an 86 bagger!).


Moderation and Stabilisation: HOLD: Fair Price based on a 4-year Cycle is $12.08
Recently Updated Narratives


An amazing opportunity to potentially get a 100 bagger

Amazon: Why the World’s Biggest Platform Still Runs on Invisible Economics

Sunrun Stock: When the Energy Transition Collides With the Cost of Capital
Popular Narratives


MicroVision will explode future revenue by 380.37% with a vision towards success


Crazy Undervalued 42 Baggers Silver Play (Active & Running Mine)


NVDA: Expanding AI Demand Will Drive Major Data Center Investments Through 2026
Trending Discussion
