
Advertisement
Read This Before You Buy Qantas Airways Limited (ASX:QAN) Because Of Its P/E Ratio
This article is written for those who want to get better at using price to earnings ratios (P/E ratios). We'll show how you can use Qantas Airways Limited's (ASX:QAN) P/E ratio to inform your assessment of the investment opportunity. Based on the last twelve months, Qantas Airways's P/E ratio is 10.03. That means that at current prices, buyers pay A$10.03 for every A$1 in trailing yearly profits.
Want to participate in a short research study? Help shape the future of investing tools and you could win a $250 gift card!
View our latest analysis for Qantas Airways
How Do I Calculate A Price To Earnings Ratio?
The formula for P/E is:
Price to Earnings Ratio = Price per Share ÷ Earnings per Share (EPS)
Or for Qantas Airways:
P/E of 10.03 = A$5.23 ÷ A$0.52 (Based on the year to December 2018.)
Is A High Price-to-Earnings Ratio Good?
A higher P/E ratio means that investors are paying a higher price for each A$1 of company earnings. That isn't necessarily good or bad, but a high P/E implies relatively high expectations of what a company can achieve in the future.
How Growth Rates Impact P/E Ratios
Earnings growth rates have a big influence on P/E ratios. When earnings grow, the 'E' increases, over time. Therefore, even if you pay a high multiple of earnings now, that multiple will become lower in the future. So while a stock may look expensive based on past earnings, it could be cheap based on future earnings.
Qantas Airways maintained roughly steady earnings over the last twelve months. But it has grown its earnings per share by 1.7% per year over the last three years.
How Does Qantas Airways's P/E Ratio Compare To Its Peers?
We can get an indication of market expectations by looking at the P/E ratio. If you look at the image below, you can see Qantas Airways has a lower P/E than the average (11.1) in the airlines industry classification.
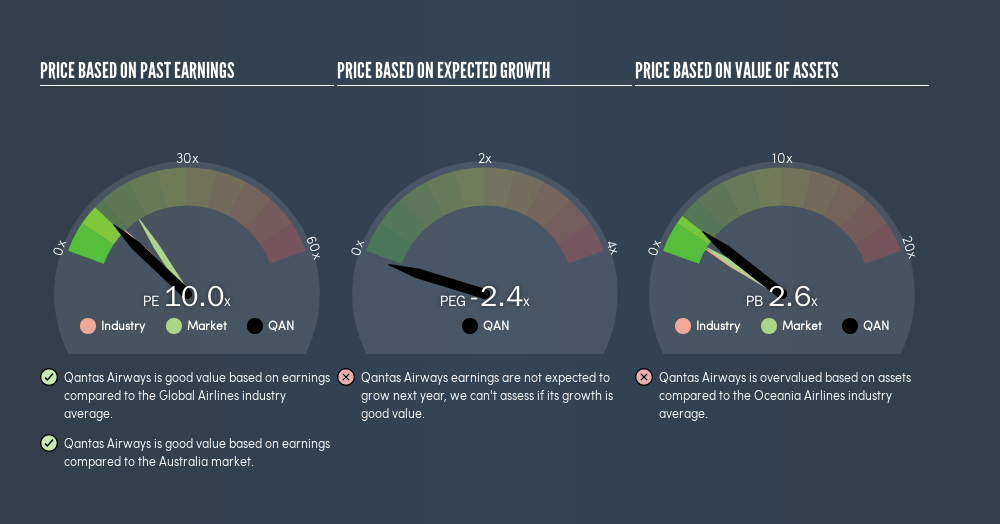
Qantas Airways's P/E tells us that market participants think it will not fare as well as its peers in the same industry. Since the market seems unimpressed with Qantas Airways, it's quite possible it could surprise on the upside. You should delve deeper. I like to check if company insiders have been buying or selling.
A Limitation: P/E Ratios Ignore Debt and Cash In The Bank
One drawback of using a P/E ratio is that it considers market capitalization, but not the balance sheet. That means it doesn't take debt or cash into account. The exact same company would hypothetically deserve a higher P/E ratio if it had a strong balance sheet, than if it had a weak one with lots of debt, because a cashed up company can spend on growth.
While growth expenditure doesn't always pay off, the point is that it is a good option to have; but one that the P/E ratio ignores.
Qantas Airways's Balance Sheet
Net debt is 43% of Qantas Airways's market cap. You'd want to be aware of this fact, but it doesn't bother us.
The Bottom Line On Qantas Airways's P/E Ratio
Qantas Airways trades on a P/E ratio of 10, which is below the AU market average of 16. EPS grew over the last twelve months, and debt levels are quite reasonable. If you believe growth will continue - or even increase - then the low P/E may signify opportunity.
When the market is wrong about a stock, it gives savvy investors an opportunity. If it is underestimating a company, investors can make money by buying and holding the shares until the market corrects itself. So this free visualization of the analyst consensus on future earnings could help you make the right decision about whether to buy, sell, or hold.
Of course, you might find a fantastic investment by looking at a few good candidates. So take a peek at this free list of companies with modest (or no) debt, trading on a P/E below 20.
We aim to bring you long-term focused research analysis driven by fundamental data. Note that our analysis may not factor in the latest price-sensitive company announcements or qualitative material.
If you spot an error that warrants correction, please contact the editor at editorial-team@simplywallst.com. This article by Simply Wall St is general in nature. It does not constitute a recommendation to buy or sell any stock, and does not take account of your objectives, or your financial situation. Simply Wall St has no position in the stocks mentioned. Thank you for reading.
About ASX:QAN
Qantas Airways
Provides air transportation services in Australia and internationally.
Moderate growth potential second-rate dividend payer.
Similar Companies
Market Insights


Advertisement
Community Narratives
For the Emperor: Why Games Workshop Could Be a Star Investment
Fair Value UK£160.00|0.4% undervalued
RO
Community Contributor
Securitas will boost margins with AI and tech-driven services
Fair Value SEK 260.91|45.0% undervalued
UN
Community Contributor
A Leader in EV Charging with Growth Potential
Fair Value €27.00|20.4% undervalued
TI
Community Contributor