
Advertisement
MNF Group Limited (ASX:MNF) Is Employing Capital Very Effectively

Today we are going to look at MNF Group Limited (ASX:MNF) to see whether it might be an attractive investment prospect. In particular, we'll consider its Return On Capital Employed (ROCE), as that can give us insight into how profitably the company is able to employ capital in its business.
First up, we'll look at what ROCE is and how we calculate it. Then we'll compare its ROCE to similar companies. Last but not least, we'll look at what impact its current liabilities have on its ROCE.
Return On Capital Employed (ROCE): What is it?
ROCE measures the amount of pre-tax profits a company can generate from the capital employed in its business. All else being equal, a better business will have a higher ROCE. In brief, it is a useful tool, but it is not without drawbacks. Author Edwin Whiting says to be careful when comparing the ROCE of different businesses, since 'No two businesses are exactly alike.'
How Do You Calculate Return On Capital Employed?
Analysts use this formula to calculate return on capital employed:
Return on Capital Employed = Earnings Before Interest and Tax (EBIT) ÷ (Total Assets - Current Liabilities)
Or for MNF Group:
0.11 = AU$14m ÷ (AU$171m - AU$45m) (Based on the trailing twelve months to December 2018.)
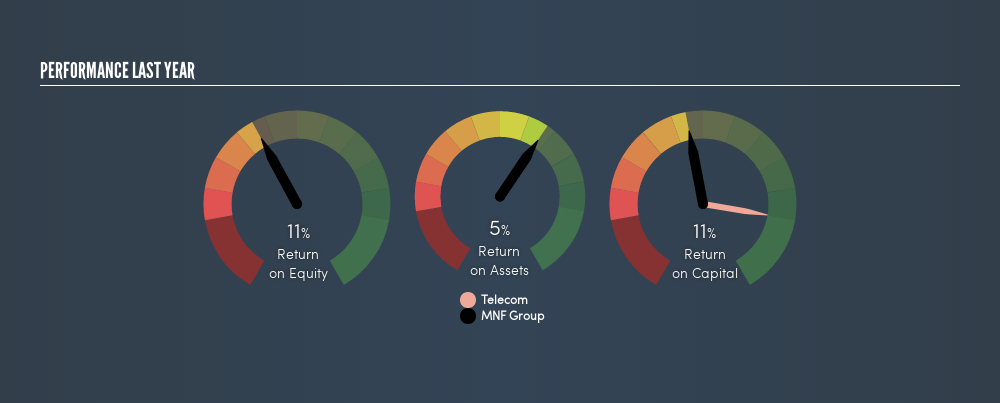
Therefore, MNF Group has an ROCE of 11%.
Check out our latest analysis for MNF Group
Does MNF Group Have A Good ROCE?
When making comparisons between similar businesses, investors may find ROCE useful. In our analysis, MNF Group's ROCE is meaningfully higher than the 8.2% average in the Telecom industry. We consider this a positive sign, because it suggests it uses capital more efficiently than similar companies. Independently of how MNF Group compares to its industry, its ROCE in absolute terms appears decent, and the company may be worthy of closer investigation.
As we can see, MNF Group currently has an ROCE of 11%, less than the 24% it reported 3 years ago. This makes us wonder if the business is facing new challenges.
It is important to remember that ROCE shows past performance, and is not necessarily predictive. Companies in cyclical industries can be difficult to understand using ROCE, as returns typically look high during boom times, and low during busts. ROCE is, after all, simply a snap shot of a single year. What happens in the future is pretty important for investors, so we have prepared a freereport on analyst forecasts for MNF Group.
Do MNF Group's Current Liabilities Skew Its ROCE?
Short term (or current) liabilities, are things like supplier invoices, overdrafts, or tax bills that need to be paid within 12 months. Due to the way ROCE is calculated, a high level of current liabilities makes a company look as though it has less capital employed, and thus can (sometimes unfairly) boost the ROCE. To counteract this, we check if a company has high current liabilities, relative to its total assets.
MNF Group has total liabilities of AU$45m and total assets of AU$171m. Therefore its current liabilities are equivalent to approximately 26% of its total assets. A fairly low level of current liabilities is not influencing the ROCE too much.
Our Take On MNF Group's ROCE
This is good to see, and with a sound ROCE, MNF Group could be worth a closer look. But note: MNF Group may not be the best stock to buy. So take a peek at this freelist of interesting companies with strong recent earnings growth (and a P/E ratio below 20).
I will like MNF Group better if I see some big insider buys. While we wait, check out this freelist of growing companies with considerable, recent, insider buying.
We aim to bring you long-term focused research analysis driven by fundamental data. Note that our analysis may not factor in the latest price-sensitive company announcements or qualitative material.
If you spot an error that warrants correction, please contact the editor at editorial-team@simplywallst.com. This article by Simply Wall St is general in nature. It does not constitute a recommendation to buy or sell any stock, and does not take account of your objectives, or your financial situation. Simply Wall St has no position in the stocks mentioned. Thank you for reading.
About ASX:SYM
Symbio Holdings
Symbio Holdings Limited provides communication services to software companies, telecom providers, and enterprise customers in Australia, New Zealand, and Internationally.
Flawless balance sheet with reasonable growth potential.
Market Insights


Advertisement
Community Narratives
The Future of Drug Testing? Fingerprint Tech Shows Serious Promise
Fair Value US$2.98|40.3% undervalued
JO
Community Contributor
Suncorp’s Next Chapter: Insurance-Only and Ready to Grow
Fair Value AU$22.83|7.9% undervalued
RO
Community Contributor
Thyssenkrupp Nucera Will Achieve Double-Digit Profits by 2030 Boosted by Hydrogen Growth
Fair Value €14.40|31.3% undervalued
CH
Community Contributor
Tesla’s Nvidia Moment – The AI & Robotics Inflection Point
Fair Value US$359.72|12.3% undervalued
BL
Community Contributor