
Advertisement
Shareholders of Dicker Data (ASX:DDR) Must Be Delighted With Their 979% Total Return
Long term investing can be life changing when you buy and hold the truly great businesses. And highest quality companies can see their share prices grow by huge amounts. Don't believe it? Then look at the Dicker Data Limited (ASX:DDR) share price. It's 694% higher than it was five years ago. And this is just one example of the epic gains achieved by some long term investors. It's also good to see the share price up 23% over the last quarter. But this move may well have been assisted by the reasonably buoyant market (up 12% in 90 days).
Anyone who held for that rewarding ride would probably be keen to talk about it.
Check out our latest analysis for Dicker Data
In his essay The Superinvestors of Graham-and-Doddsville Warren Buffett described how share prices do not always rationally reflect the value of a business. One imperfect but simple way to consider how the market perception of a company has shifted is to compare the change in the earnings per share (EPS) with the share price movement.
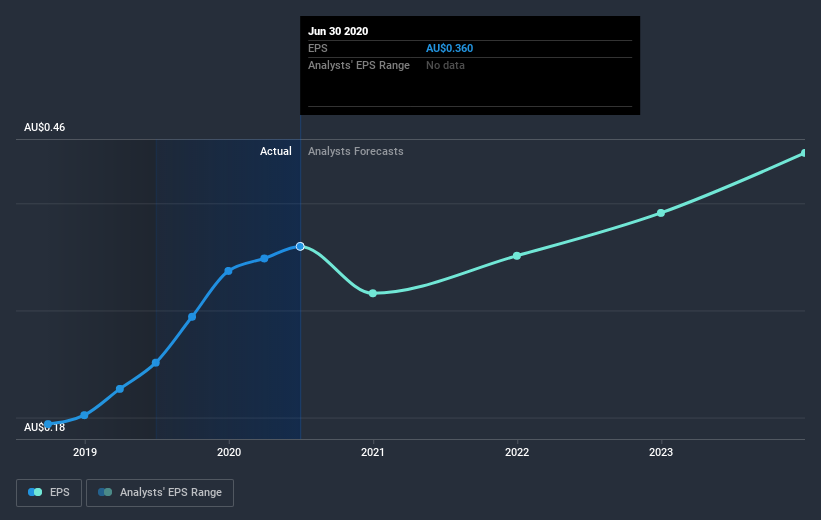
Over half a decade, Dicker Data managed to grow its earnings per share at 32% a year. This EPS growth is lower than the 51% average annual increase in the share price. This suggests that market participants hold the company in higher regard, these days. And that's hardly shocking given the track record of growth.
The graphic below depicts how EPS has changed over time (unveil the exact values by clicking on the image).
It's probably worth noting we've seen significant insider buying in the last quarter, which we consider a positive. That said, we think earnings and revenue growth trends are even more important factors to consider. It might be well worthwhile taking a look at our free report on Dicker Data's earnings, revenue and cash flow.
What About Dividends?
As well as measuring the share price return, investors should also consider the total shareholder return (TSR). Whereas the share price return only reflects the change in the share price, the TSR includes the value of dividends (assuming they were reinvested) and the benefit of any discounted capital raising or spin-off. It's fair to say that the TSR gives a more complete picture for stocks that pay a dividend. We note that for Dicker Data the TSR over the last 5 years was 979%, which is better than the share price return mentioned above. This is largely a result of its dividend payments!
A Different Perspective
We're pleased to report that Dicker Data shareholders have received a total shareholder return of 77% over one year. Of course, that includes the dividend. That gain is better than the annual TSR over five years, which is 61%. Therefore it seems like sentiment around the company has been positive lately. Someone with an optimistic perspective could view the recent improvement in TSR as indicating that the business itself is getting better with time. While it is well worth considering the different impacts that market conditions can have on the share price, there are other factors that are even more important. Take risks, for example - Dicker Data has 4 warning signs (and 1 which doesn't sit too well with us) we think you should know about.
If you like to buy stocks alongside management, then you might just love this free list of companies. (Hint: insiders have been buying them).
Please note, the market returns quoted in this article reflect the market weighted average returns of stocks that currently trade on AU exchanges.
When trading Dicker Data or any other investment, use the platform considered by many to be the Professional's Gateway to the Worlds Market, Interactive Brokers. You get the lowest-cost* trading on stocks, options, futures, forex, bonds and funds worldwide from a single integrated account. Promoted
New: Manage All Your Stock Portfolios in One Place
We've created the ultimate portfolio companion for stock investors, and it's free.
• Connect an unlimited number of Portfolios and see your total in one currency
• Be alerted to new Warning Signs or Risks via email or mobile
• Track the Fair Value of your stocks
This article by Simply Wall St is general in nature. It does not constitute a recommendation to buy or sell any stock, and does not take account of your objectives, or your financial situation. We aim to bring you long-term focused analysis driven by fundamental data. Note that our analysis may not factor in the latest price-sensitive company announcements or qualitative material. Simply Wall St has no position in any stocks mentioned.
*Interactive Brokers Rated Lowest Cost Broker by StockBrokers.com Annual Online Review 2020
Have feedback on this article? Concerned about the content? Get in touch with us directly. Alternatively, email editorial-team (at) simplywallst.com.
About ASX:DDR
Dicker Data
Engages in the wholesale distribution of computer hardware, software, and related products for corporate and commercial markets in Australia and New Zealand.
Adequate balance sheet and fair value.
Market Insights

Advertisement
Community Narratives
Pinterest will surge as advertising innovations ignite revenue growth
Fair Value US$42.63|27.0% undervalued
BR
Community Contributor
Brambles' Revenue Set to Climb 14% with Profit Margins Following
Fair Value AU$21.90|5.9% overvalued
RO
Community Contributor
Challenging Future for STG as Organic Sales Decline by 8.8%
Fair Value DKK 116.13|26.8% undervalued
KA
Community Contributor