XPON Technologies Group Limited (ASX:XPN) Might Not Be As Mispriced As It Looks After Plunging 34%

XPON Technologies Group Limited (ASX:XPN) shareholders that were waiting for something to happen have been dealt a blow with a 34% share price drop in the last month. For any long-term shareholders, the last month ends a year to forget by locking in a 50% share price decline.
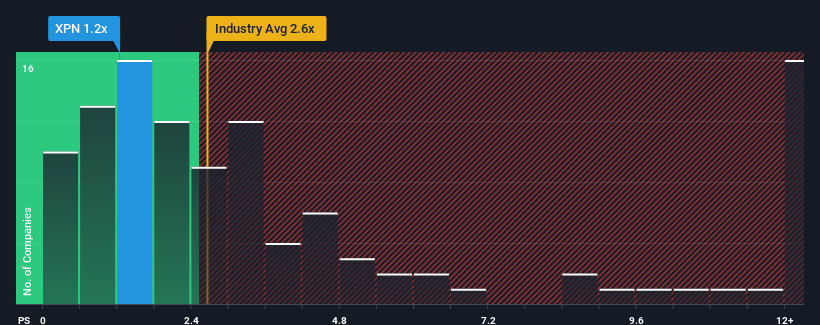
After such a large drop in price, XPON Technologies Group may be sending bullish signals at the moment with its price-to-sales (or "P/S") ratio of 1.2x, since almost half of all companies in the Software industry in Australia have P/S ratios greater than 2.6x and even P/S higher than 6x are not unusual. However, the P/S might be low for a reason and it requires further investigation to determine if it's justified.
See our latest analysis for XPON Technologies Group
What Does XPON Technologies Group's P/S Mean For Shareholders?
With revenue growth that's superior to most other companies of late, XPON Technologies Group has been doing relatively well. Perhaps the market is expecting future revenue performance to dive, which has kept the P/S suppressed. If you like the company, you'd be hoping this isn't the case so that you could potentially pick up some stock while it's out of favour.
Want the full picture on analyst estimates for the company? Then our free report on XPON Technologies Group will help you uncover what's on the horizon.Do Revenue Forecasts Match The Low P/S Ratio?
XPON Technologies Group's P/S ratio would be typical for a company that's only expected to deliver limited growth, and importantly, perform worse than the industry.
If we review the last year of revenue growth, the company posted a terrific increase of 66%. The latest three year period has also seen an incredible overall rise in revenue, aided by its incredible short-term performance. Therefore, it's fair to say the revenue growth recently has been superb for the company.
Shifting to the future, estimates from the one analyst covering the company suggest revenue should grow by 37% per year over the next three years. With the industry only predicted to deliver 21% per year, the company is positioned for a stronger revenue result.
With this in consideration, we find it intriguing that XPON Technologies Group's P/S sits behind most of its industry peers. Apparently some shareholders are doubtful of the forecasts and have been accepting significantly lower selling prices.
The Final Word
The southerly movements of XPON Technologies Group's shares means its P/S is now sitting at a pretty low level. We'd say the price-to-sales ratio's power isn't primarily as a valuation instrument but rather to gauge current investor sentiment and future expectations.
To us, it seems XPON Technologies Group currently trades on a significantly depressed P/S given its forecasted revenue growth is higher than the rest of its industry. The reason for this depressed P/S could potentially be found in the risks the market is pricing in. It appears the market could be anticipating revenue instability, because these conditions should normally provide a boost to the share price.
Having said that, be aware XPON Technologies Group is showing 2 warning signs in our investment analysis, you should know about.
Of course, profitable companies with a history of great earnings growth are generally safer bets. So you may wish to see this free collection of other companies that have reasonable P/E ratios and have grown earnings strongly.
The New Payments ETF Is Live on NASDAQ:
Money is moving to real-time rails, and a newly listed ETF now gives investors direct exposure. Fast settlement. Institutional custody. Simple access.
Explore how this launch could reshape portfolios
Sponsored ContentNew: AI Stock Screener & Alerts
Our new AI Stock Screener scans the market every day to uncover opportunities.
• Dividend Powerhouses (3%+ Yield)
• Undervalued Small Caps with Insider Buying
• High growth Tech and AI Companies
Or build your own from over 50 metrics.
Have feedback on this article? Concerned about the content? Get in touch with us directly. Alternatively, email editorial-team (at) simplywallst.com.
This article by Simply Wall St is general in nature. We provide commentary based on historical data and analyst forecasts only using an unbiased methodology and our articles are not intended to be financial advice. It does not constitute a recommendation to buy or sell any stock, and does not take account of your objectives, or your financial situation. We aim to bring you long-term focused analysis driven by fundamental data. Note that our analysis may not factor in the latest price-sensitive company announcements or qualitative material. Simply Wall St has no position in any stocks mentioned.
About ASX:XPN
XPON Technologies Group
Provides software solutions to corporate and enterprises in Australia and the United Kingdom.
Moderate risk and slightly overvalued.
Similar Companies
Market Insights

Weekly Picks

Early mover in a fast growing industry. Likely to experience share price volatility as they scale


A case for CA$31.80 (undiluted), aka 8,616% upside from CA$0.37 (an 86 bagger!).


Moderation and Stabilisation: HOLD: Fair Price based on a 4-year Cycle is $12.08
Recently Updated Narratives

Airbnb Stock: Platform Growth in a World of Saturation and Scrutiny

Adobe Stock: AI-Fueled ARR Growth Pushes Guidance Higher, But Cost Pressures Loom

Thomson Reuters Stock: When Legal Intelligence Becomes Mission-Critical Infrastructure
Popular Narratives


Crazy Undervalued 42 Baggers Silver Play (Active & Running Mine)


NVDA: Expanding AI Demand Will Drive Major Data Center Investments Through 2026

The AI Infrastructure Giant Grows Into Its Valuation
Trending Discussion


