Vection Technologies (ASX:VR1) Is Making Moderate Use Of Debt

David Iben put it well when he said, 'Volatility is not a risk we care about. What we care about is avoiding the permanent loss of capital.' So it might be obvious that you need to consider debt, when you think about how risky any given stock is, because too much debt can sink a company. We note that Vection Technologies Limited (ASX:VR1) does have debt on its balance sheet. But the real question is whether this debt is making the company risky.
Why Does Debt Bring Risk?
Debt is a tool to help businesses grow, but if a business is incapable of paying off its lenders, then it exists at their mercy. In the worst case scenario, a company can go bankrupt if it cannot pay its creditors. However, a more frequent (but still costly) occurrence is where a company must issue shares at bargain-basement prices, permanently diluting shareholders, just to shore up its balance sheet. By replacing dilution, though, debt can be an extremely good tool for businesses that need capital to invest in growth at high rates of return. The first thing to do when considering how much debt a business uses is to look at its cash and debt together.
View our latest analysis for Vection Technologies
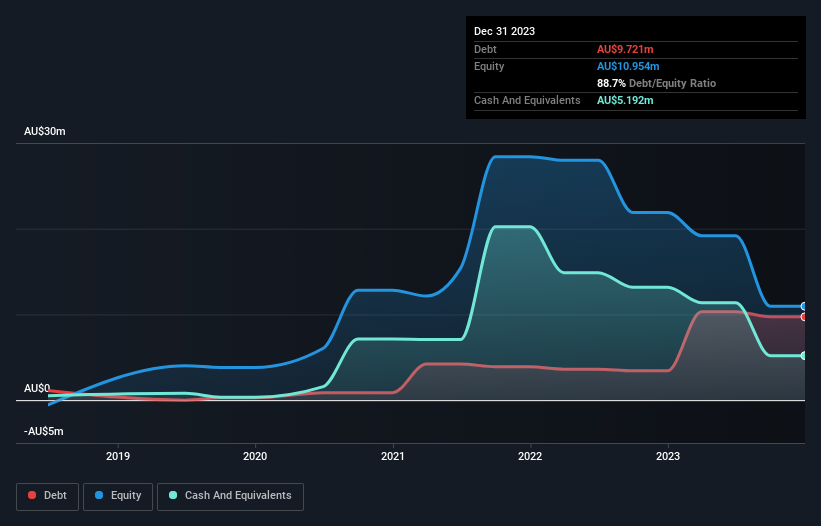
What Is Vection Technologies's Debt?
As you can see below, at the end of December 2023, Vection Technologies had AU$9.72m of debt, up from AU$3.42m a year ago. Click the image for more detail. However, because it has a cash reserve of AU$5.19m, its net debt is less, at about AU$4.53m.
How Strong Is Vection Technologies' Balance Sheet?
Zooming in on the latest balance sheet data, we can see that Vection Technologies had liabilities of AU$19.8m due within 12 months and liabilities of AU$9.33m due beyond that. Offsetting this, it had AU$5.19m in cash and AU$11.0m in receivables that were due within 12 months. So its liabilities total AU$12.9m more than the combination of its cash and short-term receivables.
Vection Technologies has a market capitalization of AU$28.2m, so it could very likely raise cash to ameliorate its balance sheet, if the need arose. But it's clear that we should definitely closely examine whether it can manage its debt without dilution. When analysing debt levels, the balance sheet is the obvious place to start. But it is Vection Technologies's earnings that will influence how the balance sheet holds up in the future. So when considering debt, it's definitely worth looking at the earnings trend. Click here for an interactive snapshot.
In the last year Vection Technologies wasn't profitable at an EBIT level, but managed to grow its revenue by 70%, to AU$29m. Shareholders probably have their fingers crossed that it can grow its way to profits.
Caveat Emptor
While we can certainly appreciate Vection Technologies's revenue growth, its earnings before interest and tax (EBIT) loss is not ideal. Indeed, it lost a very considerable AU$9.1m at the EBIT level. Considering that alongside the liabilities mentioned above does not give us much confidence that company should be using so much debt. So we think its balance sheet is a little strained, though not beyond repair. However, it doesn't help that it burned through AU$14m of cash over the last year. So suffice it to say we consider the stock very risky. The balance sheet is clearly the area to focus on when you are analysing debt. However, not all investment risk resides within the balance sheet - far from it. For example, we've discovered 3 warning signs for Vection Technologies (2 don't sit too well with us!) that you should be aware of before investing here.
If, after all that, you're more interested in a fast growing company with a rock-solid balance sheet, then check out our list of net cash growth stocks without delay.
Mobile Infrastructure for Defense and Disaster
The next wave in robotics isn't humanoid. Its fully autonomous towers delivering 5G, ISR, and radar in under 30 minutes, anywhere.
Get the investor briefing before the next round of contracts
Sponsored On Behalf of CiTechNew: Manage All Your Stock Portfolios in One Place
We've created the ultimate portfolio companion for stock investors, and it's free.
• Connect an unlimited number of Portfolios and see your total in one currency
• Be alerted to new Warning Signs or Risks via email or mobile
• Track the Fair Value of your stocks
Have feedback on this article? Concerned about the content? Get in touch with us directly. Alternatively, email editorial-team (at) simplywallst.com.
This article by Simply Wall St is general in nature. We provide commentary based on historical data and analyst forecasts only using an unbiased methodology and our articles are not intended to be financial advice. It does not constitute a recommendation to buy or sell any stock, and does not take account of your objectives, or your financial situation. We aim to bring you long-term focused analysis driven by fundamental data. Note that our analysis may not factor in the latest price-sensitive company announcements or qualitative material. Simply Wall St has no position in any stocks mentioned.
About ASX:VR1
Vection Technologies
An enterprise-focused company, develops and commercializes integrated digital transformation technology solutions and services in Australia.
Slight risk with mediocre balance sheet.
Market Insights

Weekly Picks

Early mover in a fast growing industry. Likely to experience share price volatility as they scale


A case for CA$31.80 (undiluted), aka 8,616% upside from CA$0.37 (an 86 bagger!).


Moderation and Stabilisation: HOLD: Fair Price based on a 4-year Cycle is $12.08
Recently Updated Narratives


An amazing opportunity to potentially get a 100 bagger

Amazon: Why the World’s Biggest Platform Still Runs on Invisible Economics

Sunrun Stock: When the Energy Transition Collides With the Cost of Capital
Popular Narratives


MicroVision will explode future revenue by 380.37% with a vision towards success


Crazy Undervalued 42 Baggers Silver Play (Active & Running Mine)

