
Advertisement
- Australia
- /
- Diversified Financial
- /
- ASX:FND
Is Vortiv Limited's (ASX:VOR) Recent Stock Performance Influenced By Its Fundamentals In Any Way?
Vortiv (ASX:VOR) has had a great run on the share market with its stock up by a significant 6.1% over the last month. Given that stock prices are usually aligned with a company's financial performance in the long-term, we decided to study its financial indicators more closely to see if they had a hand to play in the recent price move. Specifically, we decided to study Vortiv's ROE in this article.
ROE or return on equity is a useful tool to assess how effectively a company can generate returns on the investment it received from its shareholders. In short, ROE shows the profit each dollar generates with respect to its shareholder investments.
See our latest analysis for Vortiv
How Do You Calculate Return On Equity?
The formula for ROE is:
Return on Equity = Net Profit (from continuing operations) ÷ Shareholders' Equity
So, based on the above formula, the ROE for Vortiv is:
7.6% = AU$1.4m ÷ AU$19m (Based on the trailing twelve months to September 2020).
The 'return' is the yearly profit. That means that for every A$1 worth of shareholders' equity, the company generated A$0.08 in profit.
Why Is ROE Important For Earnings Growth?
We have already established that ROE serves as an efficient profit-generating gauge for a company's future earnings. Based on how much of its profits the company chooses to reinvest or "retain", we are then able to evaluate a company's future ability to generate profits. Assuming everything else remains unchanged, the higher the ROE and profit retention, the higher the growth rate of a company compared to companies that don't necessarily bear these characteristics.
Vortiv's Earnings Growth And 7.6% ROE
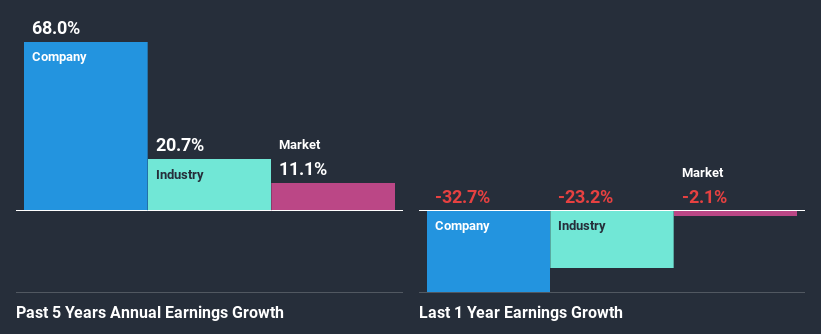
On the face of it, Vortiv's ROE is not much to talk about. We then compared the company's ROE to the broader industry and were disappointed to see that the ROE is lower than the industry average of 10.0%. In spite of this, Vortiv was able to grow its net income considerably, at a rate of 68% in the last five years. Therefore, there could be other reasons behind this growth. For example, it is possible that the company's management has made some good strategic decisions, or that the company has a low payout ratio.
We then compared Vortiv's net income growth with the industry and we're pleased to see that the company's growth figure is higher when compared with the industry which has a growth rate of 21% in the same period.
Earnings growth is an important metric to consider when valuing a stock. What investors need to determine next is if the expected earnings growth, or the lack of it, is already built into the share price. Doing so will help them establish if the stock's future looks promising or ominous. If you're wondering about Vortiv's's valuation, check out this gauge of its price-to-earnings ratio, as compared to its industry.
Is Vortiv Making Efficient Use Of Its Profits?
Summary
In total, it does look like Vortiv has some positive aspects to its business. Even in spite of the low rate of return, the company has posted impressive earnings growth as a result of reinvesting heavily into its business. While we won't completely dismiss the company, what we would do, is try to ascertain how risky the business is to make a more informed decision around the company. To know the 3 risks we have identified for Vortiv visit our risks dashboard for free.
If you decide to trade Vortiv, use the lowest-cost* platform that is rated #1 Overall by Barron’s, Interactive Brokers. Trade stocks, options, futures, forex, bonds and funds on 135 markets, all from a single integrated account. Promoted
New: AI Stock Screener & Alerts
Our new AI Stock Screener scans the market every day to uncover opportunities.
• Dividend Powerhouses (3%+ Yield)
• Undervalued Small Caps with Insider Buying
• High growth Tech and AI Companies
Or build your own from over 50 metrics.
This article by Simply Wall St is general in nature. It does not constitute a recommendation to buy or sell any stock, and does not take account of your objectives, or your financial situation. We aim to bring you long-term focused analysis driven by fundamental data. Note that our analysis may not factor in the latest price-sensitive company announcements or qualitative material. Simply Wall St has no position in any stocks mentioned.
*Interactive Brokers Rated Lowest Cost Broker by StockBrokers.com Annual Online Review 2020
Have feedback on this article? Concerned about the content? Get in touch with us directly. Alternatively, email editorial-team (at) simplywallst.com.
About ASX:FND
Findi
Through its subsidiaries, engages in the development of digital payment systems in India.
Low risk and slightly overvalued.
Market Insights

Advertisement
Community Narratives
MINISO's fair value is projected at 26.69 with an anticipated PE ratio shift of 20x
Fair Value US$24.03|11.0% undervalued
BE
Community Contributor
Procter & Gamble: A Dividend Giant Facing Slowing Growth
Fair Value US$119.81|23.3% overvalued
AN
Community Contributor
Eli Lilly's Future Growth Driven by Tirzepatide and Favorable Market Conditions
Fair Value US$1.19k|13.8% undervalued
EA
Community Contributor