
Advertisement
Spirit Technology Solutions Ltd's (ASX:ST1) Price Is Right But Growth Is Lacking After Shares Rocket 28%
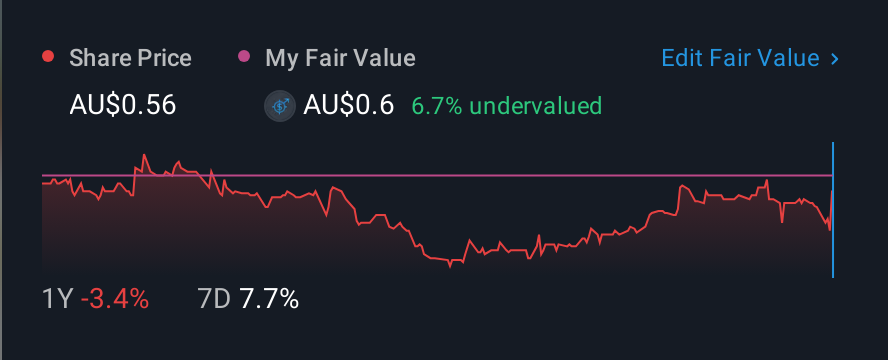
Despite an already strong run, Spirit Technology Solutions Ltd (ASX:ST1) shares have been powering on, with a gain of 28% in the last thirty days. But the gains over the last month weren't enough to make shareholders whole, as the share price is still down 8.7% in the last twelve months.
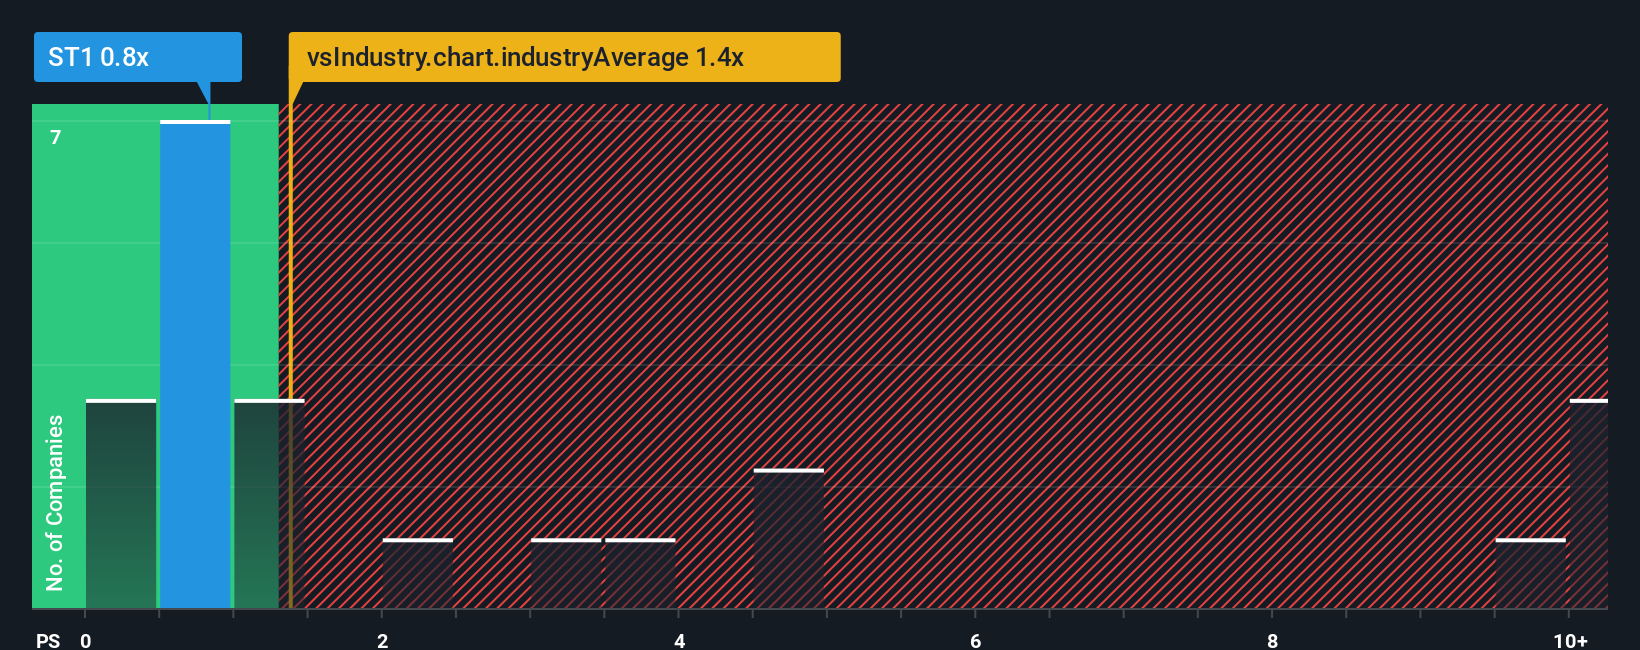
Although its price has surged higher, Spirit Technology Solutions may still be sending bullish signals at the moment with its price-to-sales (or "P/S") ratio of 0.8x, since almost half of all companies in the IT industry in Australia have P/S ratios greater than 1.4x and even P/S higher than 5x are not unusual. However, the P/S might be low for a reason and it requires further investigation to determine if it's justified.
See our latest analysis for Spirit Technology Solutions
What Does Spirit Technology Solutions' Recent Performance Look Like?
The revenue growth achieved at Spirit Technology Solutions over the last year would be more than acceptable for most companies. It might be that many expect the respectable revenue performance to degrade substantially, which has repressed the P/S. If that doesn't eventuate, then existing shareholders have reason to be optimistic about the future direction of the share price.
Although there are no analyst estimates available for Spirit Technology Solutions, take a look at this free data-rich visualisation to see how the company stacks up on earnings, revenue and cash flow.What Are Revenue Growth Metrics Telling Us About The Low P/S?
Spirit Technology Solutions' P/S ratio would be typical for a company that's only expected to deliver limited growth, and importantly, perform worse than the industry.
Retrospectively, the last year delivered an exceptional 28% gain to the company's top line. Revenue has also lifted 5.3% in aggregate from three years ago, mostly thanks to the last 12 months of growth. Therefore, it's fair to say the revenue growth recently has been respectable for the company.
Comparing the recent medium-term revenue trends against the industry's one-year growth forecast of 36% shows it's noticeably less attractive.
With this information, we can see why Spirit Technology Solutions is trading at a P/S lower than the industry. Apparently many shareholders weren't comfortable holding on to something they believe will continue to trail the wider industry.
The Key Takeaway
The latest share price surge wasn't enough to lift Spirit Technology Solutions' P/S close to the industry median. It's argued the price-to-sales ratio is an inferior measure of value within certain industries, but it can be a powerful business sentiment indicator.
In line with expectations, Spirit Technology Solutions maintains its low P/S on the weakness of its recent three-year growth being lower than the wider industry forecast. At this stage investors feel the potential for an improvement in revenue isn't great enough to justify a higher P/S ratio. If recent medium-term revenue trends continue, it's hard to see the share price experience a reversal of fortunes anytime soon.
And what about other risks? Every company has them, and we've spotted 3 warning signs for Spirit Technology Solutions (of which 2 make us uncomfortable!) you should know about.
If these risks are making you reconsider your opinion on Spirit Technology Solutions, explore our interactive list of high quality stocks to get an idea of what else is out there.
New: Manage All Your Stock Portfolios in One Place
We've created the ultimate portfolio companion for stock investors, and it's free.
• Connect an unlimited number of Portfolios and see your total in one currency
• Be alerted to new Warning Signs or Risks via email or mobile
• Track the Fair Value of your stocks
Have feedback on this article? Concerned about the content? Get in touch with us directly. Alternatively, email editorial-team (at) simplywallst.com.
This article by Simply Wall St is general in nature. We provide commentary based on historical data and analyst forecasts only using an unbiased methodology and our articles are not intended to be financial advice. It does not constitute a recommendation to buy or sell any stock, and does not take account of your objectives, or your financial situation. We aim to bring you long-term focused analysis driven by fundamental data. Note that our analysis may not factor in the latest price-sensitive company announcements or qualitative material. Simply Wall St has no position in any stocks mentioned.
About ASX:ST1
Spirit Technology Solutions
Engages in the provision of cyber security, and technology services and solutions in Australia.
Mediocre balance sheet with low risk.
Market Insights

Advertisement
Community Narratives
Quality at a Premium. A time to watch, not to buy?
Fair Value US$154.56|27.6% undervalued
DA
Community Contributor
GRAB: The Super-App at the Heart of Southeast Asia’s Digital Boom
Fair Value US$8.20|22.1% undervalued
BL
Community Contributor
Verve Group to Surge with 51.61% Revenue Growth
Fair Value €6.00|60.0% undervalued
ME
Community Contributor