
Advertisement
While Bigtincan Holdings (ASX:BTH) shareholders have made 253% in 3 years, increasing losses might now be front of mind as stock sheds 12% this week
Bigtincan Holdings Limited (ASX:BTH) shareholders might understandably be very concerned that the share price has dropped 31% in the last quarter. In contrast, the return over three years has been impressive. In fact, the share price is up a full 240% compared to three years ago. After a run like that some may not be surprised to see prices moderate. Only time will tell if there is still too much optimism currently reflected in the share price.
While the stock has fallen 12% this week, it's worth focusing on the longer term and seeing if the stocks historical returns have been driven by the underlying fundamentals.
View our latest analysis for Bigtincan Holdings
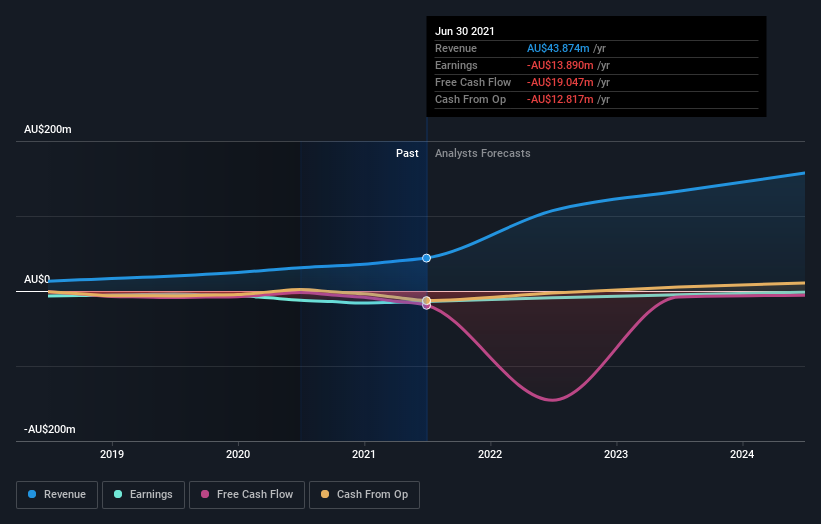
Given that Bigtincan Holdings didn't make a profit in the last twelve months, we'll focus on revenue growth to form a quick view of its business development. When a company doesn't make profits, we'd generally expect to see good revenue growth. That's because it's hard to be confident a company will be sustainable if revenue growth is negligible, and it never makes a profit.
In the last 3 years Bigtincan Holdings saw its revenue grow at 38% per year. That's well above most pre-profit companies. Along the way, the share price gained 50% per year, a solid pop by our standards. But it does seem like the market is paying attention to strong revenue growth. Nonetheless, we'd say Bigtincan Holdings is still worth investigating - successful businesses can often keep growing for long periods.
The company's revenue and earnings (over time) are depicted in the image below (click to see the exact numbers).
If you are thinking of buying or selling Bigtincan Holdings stock, you should check out this FREE detailed report on its balance sheet.
What about the Total Shareholder Return (TSR)?
We've already covered Bigtincan Holdings' share price action, but we should also mention its total shareholder return (TSR). The TSR attempts to capture the value of dividends (as if they were reinvested) as well as any spin-offs or discounted capital raisings offered to shareholders. We note that Bigtincan Holdings' TSR, at 253% is higher than its share price return of 240%. When you consider it hasn't been paying a dividend, this data suggests shareholders have benefitted from a spin-off, or had the opportunity to acquire attractively priced shares in a discounted capital raising.
A Different Perspective
Over the last year, Bigtincan Holdings shareholders took a loss of 13%. In contrast the market gained about 17%. However, keep in mind that even the best stocks will sometimes underperform the market over a twelve month period. Fortunately the longer term story is brighter, with total returns averaging about 52% per year over three years. The recent sell-off could be an opportunity if the business remains sound, so it may be worth checking the fundamental data for signs of a long-term growth trend. It's always interesting to track share price performance over the longer term. But to understand Bigtincan Holdings better, we need to consider many other factors. For example, we've discovered 4 warning signs for Bigtincan Holdings (1 doesn't sit too well with us!) that you should be aware of before investing here.
If you like to buy stocks alongside management, then you might just love this free list of companies. (Hint: insiders have been buying them).
Please note, the market returns quoted in this article reflect the market weighted average returns of stocks that currently trade on AU exchanges.
Valuation is complex, but we're here to simplify it.
Discover if Bigtincan Holdings might be undervalued or overvalued with our detailed analysis, featuring fair value estimates, potential risks, dividends, insider trades, and its financial condition.
Access Free AnalysisThis article by Simply Wall St is general in nature. We provide commentary based on historical data and analyst forecasts only using an unbiased methodology and our articles are not intended to be financial advice. It does not constitute a recommendation to buy or sell any stock, and does not take account of your objectives, or your financial situation. We aim to bring you long-term focused analysis driven by fundamental data. Note that our analysis may not factor in the latest price-sensitive company announcements or qualitative material. Simply Wall St has no position in any stocks mentioned.
Have feedback on this article? Concerned about the content? Get in touch with us directly. Alternatively, email editorial-team (at) simplywallst.com.
About ASX:BTH
Bigtincan Holdings
Develops software for sales enablement market in Australia, the United States, and internationally.
Good value with moderate growth potential.
Similar Companies
Market Insights

Advertisement
Community Narratives
100% Patient Improvement in trial puts this $16M Biotech on the radar
Fair Value US$5.30|69.8% undervalued
JO
Community Contributor
Exxon Mobil's 17.5% Upside Promises Industry-Leading Returns in Energy Transition
Fair Value US$132.00|15.0% undervalued
HE
Community Contributor
NHC Analysis: Quality at a Good Price. A Golden Opportunity?
Fair Value US$179.80|36.1% undervalued
DA
Community Contributor
Product Refresh And Global Expansion Will Empower Future Market Leadership
Fair Value US$202.60|21.1% undervalued
AN
Based on Analyst Price Targets