
Advertisement
Life360 (ASX:360) pulls back 3.3% this week, but still delivers shareholders fantastic 40% CAGR over 5 years

Long term investing can be life changing when you buy and hold the truly great businesses. And we've seen some truly amazing gains over the years. Don't believe it? Then look at the Life360, Inc. (ASX:360) share price. It's 432% higher than it was five years ago. This just goes to show the value creation that some businesses can achieve. On top of that, the share price is up 33% in about a quarter.
While the stock has fallen 3.3% this week, it's worth focusing on the longer term and seeing if the stocks historical returns have been driven by the underlying fundamentals.
Check out our latest analysis for Life360
Because Life360 made a loss in the last twelve months, we think the market is probably more focussed on revenue and revenue growth, at least for now. When a company doesn't make profits, we'd generally hope to see good revenue growth. That's because fast revenue growth can be easily extrapolated to forecast profits, often of considerable size.
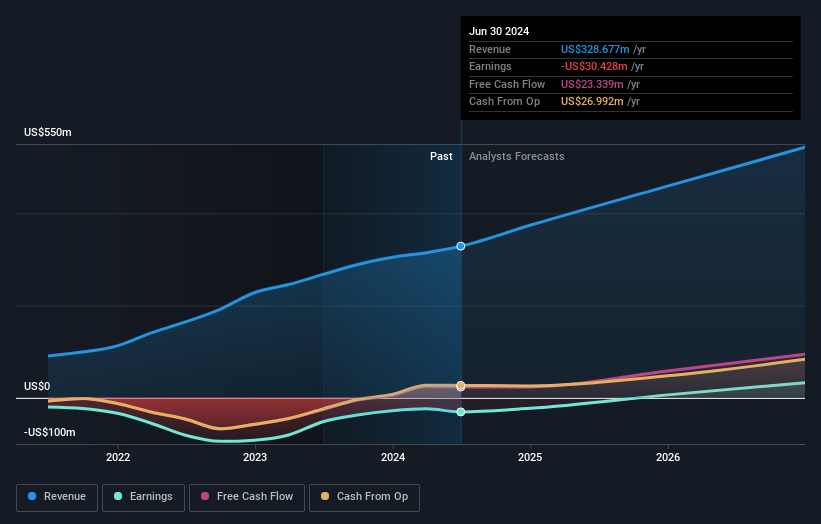
In the last 5 years Life360 saw its revenue grow at 39% per year. That's well above most pre-profit companies. Fortunately, the market has not missed this, and has pushed the share price up by 40% per year in that time. Despite the strong run, top performers like Life360 have been known to go on winning for decades. On the face of it, this looks lke a good opportunity, although we note sentiment seems very positive already.
You can see how earnings and revenue have changed over time in the image below (click on the chart to see the exact values).
Life360 is well known by investors, and plenty of clever analysts have tried to predict the future profit levels. You can see what analysts are predicting for Life360 in this interactive graph of future profit estimates.
What About The Total Shareholder Return (TSR)?
We've already covered Life360's share price action, but we should also mention its total shareholder return (TSR). Arguably the TSR is a more complete return calculation because it accounts for the value of dividends (as if they were reinvested), along with the hypothetical value of any discounted capital that have been offered to shareholders. We note that Life360's TSR, at 435% is higher than its share price return of 432%. When you consider it hasn't been paying a dividend, this data suggests shareholders have benefitted from a spin-off, or had the opportunity to acquire attractively priced shares in a discounted capital raising.
A Different Perspective
It's nice to see that Life360 shareholders have received a total shareholder return of 111% over the last year. That gain is better than the annual TSR over five years, which is 40%. Therefore it seems like sentiment around the company has been positive lately. Given the share price momentum remains strong, it might be worth taking a closer look at the stock, lest you miss an opportunity. It's always interesting to track share price performance over the longer term. But to understand Life360 better, we need to consider many other factors. Consider risks, for instance. Every company has them, and we've spotted 2 warning signs for Life360 you should know about.
Of course Life360 may not be the best stock to buy. So you may wish to see this free collection of growth stocks.
Please note, the market returns quoted in this article reflect the market weighted average returns of stocks that currently trade on Australian exchanges.
New: AI Stock Screener & Alerts
Our new AI Stock Screener scans the market every day to uncover opportunities.
• Dividend Powerhouses (3%+ Yield)
• Undervalued Small Caps with Insider Buying
• High growth Tech and AI Companies
Or build your own from over 50 metrics.
Have feedback on this article? Concerned about the content? Get in touch with us directly. Alternatively, email editorial-team (at) simplywallst.com.
This article by Simply Wall St is general in nature. We provide commentary based on historical data and analyst forecasts only using an unbiased methodology and our articles are not intended to be financial advice. It does not constitute a recommendation to buy or sell any stock, and does not take account of your objectives, or your financial situation. We aim to bring you long-term focused analysis driven by fundamental data. Note that our analysis may not factor in the latest price-sensitive company announcements or qualitative material. Simply Wall St has no position in any stocks mentioned.
About ASX:360
Life360
Operates a technology platform to locate people, pets, and things in North America, Europe, the Middle East, Africa, and internationally.
Flawless balance sheet with high growth potential.
Similar Companies
Market Insights

Advertisement
Community Narratives
The Future of Drug Testing? Fingerprint Tech Shows Serious Promise
Fair Value US$2.98|35.9% undervalued
JO
Community Contributor
Occidental Petroleum is set to achieve a 16% profit margin improvement
Fair Value US$55.05|15.6% undervalued
DZ
Community Contributor
Argan's Revenue Set to Soar with a 13.31% Growth in the Coming Decade
Fair Value US$284.68|23.4% undervalued
KE
Community Contributor
EU#1 - From German Startup to EU’s Biggest Company
Fair Value €248.62|2.5% overvalued
TO
Community Contributor