
Advertisement
- Australia
- /
- Retail Distributors
- /
- ASX:TOY
Risks Still Elevated At These Prices As Toys"R"Us ANZ Limited (ASX:TOY) Shares Dive 40%

To the annoyance of some shareholders, Toys"R"Us ANZ Limited (ASX:TOY) shares are down a considerable 40% in the last month, which continues a horrid run for the company. For any long-term shareholders, the last month ends a year to forget by locking in a 82% share price decline.
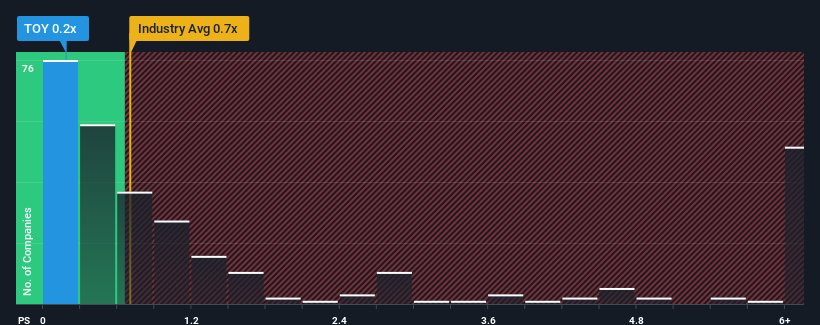
Even after such a large drop in price, you could still be forgiven for feeling indifferent about ToysRUs ANZ's P/S ratio of 0.2x, since the median price-to-sales (or "P/S") ratio for the Retail Distributors industry in Australia is also close to 0.4x. Although, it's not wise to simply ignore the P/S without explanation as investors may be disregarding a distinct opportunity or a costly mistake.
Check out our latest analysis for ToysRUs ANZ
How Has ToysRUs ANZ Performed Recently?
For example, consider that ToysRUs ANZ's financial performance has been poor lately as its revenue has been in decline. It might be that many expect the company to put the disappointing revenue performance behind them over the coming period, which has kept the P/S from falling. If you like the company, you'd at least be hoping this is the case so that you could potentially pick up some stock while it's not quite in favour.
We don't have analyst forecasts, but you can see how recent trends are setting up the company for the future by checking out our free report on ToysRUs ANZ's earnings, revenue and cash flow.Is There Some Revenue Growth Forecasted For ToysRUs ANZ?
ToysRUs ANZ's P/S ratio would be typical for a company that's only expected to deliver moderate growth, and importantly, perform in line with the industry.
In reviewing the last year of financials, we were disheartened to see the company's revenues fell to the tune of 15%. At least revenue has managed not to go completely backwards from three years ago in aggregate, thanks to the earlier period of growth. So it appears to us that the company has had a mixed result in terms of growing revenue over that time.
Comparing the recent medium-term revenue trends against the industry's one-year growth forecast of 8.4% shows it's noticeably less attractive.
With this in mind, we find it intriguing that ToysRUs ANZ's P/S is comparable to that of its industry peers. It seems most investors are ignoring the fairly limited recent growth rates and are willing to pay up for exposure to the stock. They may be setting themselves up for future disappointment if the P/S falls to levels more in line with recent growth rates.
What Does ToysRUs ANZ's P/S Mean For Investors?
With its share price dropping off a cliff, the P/S for ToysRUs ANZ looks to be in line with the rest of the Retail Distributors industry. We'd say the price-to-sales ratio's power isn't primarily as a valuation instrument but rather to gauge current investor sentiment and future expectations.
We've established that ToysRUs ANZ's average P/S is a bit surprising since its recent three-year growth is lower than the wider industry forecast. When we see weak revenue with slower than industry growth, we suspect the share price is at risk of declining, bringing the P/S back in line with expectations. Unless there is a significant improvement in the company's medium-term performance, it will be difficult to prevent the P/S ratio from declining to a more reasonable level.
Plus, you should also learn about these 6 warning signs we've spotted with ToysRUs ANZ (including 4 which are significant).
If you're unsure about the strength of ToysRUs ANZ's business, why not explore our interactive list of stocks with solid business fundamentals for some other companies you may have missed.
Valuation is complex, but we're here to simplify it.
Discover if ToysRUs ANZ might be undervalued or overvalued with our detailed analysis, featuring fair value estimates, potential risks, dividends, insider trades, and its financial condition.
Access Free AnalysisHave feedback on this article? Concerned about the content? Get in touch with us directly. Alternatively, email editorial-team (at) simplywallst.com.
This article by Simply Wall St is general in nature. We provide commentary based on historical data and analyst forecasts only using an unbiased methodology and our articles are not intended to be financial advice. It does not constitute a recommendation to buy or sell any stock, and does not take account of your objectives, or your financial situation. We aim to bring you long-term focused analysis driven by fundamental data. Note that our analysis may not factor in the latest price-sensitive company announcements or qualitative material. Simply Wall St has no position in any stocks mentioned.
About ASX:TOY
ToysRUs ANZ
Engages in distribution of toys, hobbies, and baby products in Australia.
Medium-low with weak fundamentals.
Market Insights

Advertisement
Community Narratives
Groundbreaking therapies that could change the treatment landscape for PTSD, fibromyalgia, MS & Alzheimer’s
Fair Value US$6.20|86.9% undervalued
CM
Community Contributor
DigitalOcean Will Grow 14% by Embracing AI with Paperspace Acquisition
Fair Value US$50.00|41.7% undervalued
NE
Community Contributor
Viant Technology: A Rising AdTech Challenger in the AI-Powered CTV Market
Fair Value US$38.61|63.2% undervalued
BL
Community Contributor
Volvo will Accelerate Forward into Electric and Autonomous Leadership in Five Years
Fair Value SEK 438.80|39.7% undervalued
UN
Community Contributor