
Advertisement
- Australia
- /
- Real Estate
- /
- ASX:MEA
Are Strong Financial Prospects The Force That Is Driving The Momentum In McGrath Limited's ASX:MEA) Stock?

McGrath (ASX:MEA) has had a great run on the share market with its stock up by a significant 13% over the last week. Since the market usually pay for a company’s long-term fundamentals, we decided to study the company’s key performance indicators to see if they could be influencing the market. Particularly, we will be paying attention to McGrath's ROE today.
ROE or return on equity is a useful tool to assess how effectively a company can generate returns on the investment it received from its shareholders. In other words, it is a profitability ratio which measures the rate of return on the capital provided by the company's shareholders.
See our latest analysis for McGrath
How To Calculate Return On Equity?
The formula for return on equity is:
Return on Equity = Net Profit (from continuing operations) ÷ Shareholders' Equity
So, based on the above formula, the ROE for McGrath is:
12% = AU$6.2m ÷ AU$52m (Based on the trailing twelve months to June 2023).
The 'return' is the income the business earned over the last year. That means that for every A$1 worth of shareholders' equity, the company generated A$0.12 in profit.
What Has ROE Got To Do With Earnings Growth?
Thus far, we have learned that ROE measures how efficiently a company is generating its profits. Based on how much of its profits the company chooses to reinvest or "retain", we are then able to evaluate a company's future ability to generate profits. Assuming everything else remains unchanged, the higher the ROE and profit retention, the higher the growth rate of a company compared to companies that don't necessarily bear these characteristics.
McGrath's Earnings Growth And 12% ROE
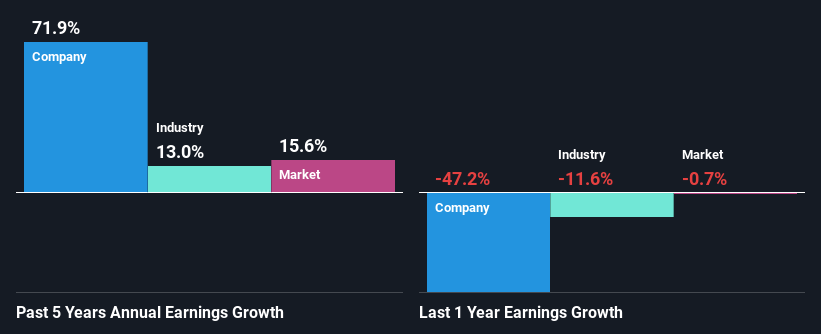
At first glance, McGrath seems to have a decent ROE. On comparing with the average industry ROE of 6.8% the company's ROE looks pretty remarkable. This probably laid the ground for McGrath's significant 72% net income growth seen over the past five years. However, there could also be other causes behind this growth. For instance, the company has a low payout ratio or is being managed efficiently.
We then compared McGrath's net income growth with the industry and we're pleased to see that the company's growth figure is higher when compared with the industry which has a growth rate of 13% in the same 5-year period.
Earnings growth is a huge factor in stock valuation. What investors need to determine next is if the expected earnings growth, or the lack of it, is already built into the share price. Doing so will help them establish if the stock's future looks promising or ominous. If you're wondering about McGrath's's valuation, check out this gauge of its price-to-earnings ratio, as compared to its industry.
Is McGrath Making Efficient Use Of Its Profits?
McGrath's three-year median payout ratio to shareholders is 20%, which is quite low. This implies that the company is retaining 80% of its profits. So it looks like McGrath is reinvesting profits heavily to grow its business, which shows in its earnings growth.
Moreover, McGrath is determined to keep sharing its profits with shareholders which we infer from its long history of seven years of paying a dividend.
Summary
On the whole, we feel that McGrath's performance has been quite good. Specifically, we like that the company is reinvesting a huge chunk of its profits at a high rate of return. This of course has caused the company to see substantial growth in its earnings. If the company continues to grow its earnings the way it has, that could have a positive impact on its share price given how earnings per share influence long-term share prices. Remember, the price of a stock is also dependent on the perceived risk. Therefore investors must keep themselves informed about the risks involved before investing in any company. To know the 3 risks we have identified for McGrath visit our risks dashboard for free.
New: Manage All Your Stock Portfolios in One Place
We've created the ultimate portfolio companion for stock investors, and it's free.
• Connect an unlimited number of Portfolios and see your total in one currency
• Be alerted to new Warning Signs or Risks via email or mobile
• Track the Fair Value of your stocks
Have feedback on this article? Concerned about the content? Get in touch with us directly. Alternatively, email editorial-team (at) simplywallst.com.
This article by Simply Wall St is general in nature. We provide commentary based on historical data and analyst forecasts only using an unbiased methodology and our articles are not intended to be financial advice. It does not constitute a recommendation to buy or sell any stock, and does not take account of your objectives, or your financial situation. We aim to bring you long-term focused analysis driven by fundamental data. Note that our analysis may not factor in the latest price-sensitive company announcements or qualitative material. Simply Wall St has no position in any stocks mentioned.
About ASX:MEA
McGrath
Operates as an integrated residential real estate services company in Australia.
Flawless balance sheet with solid track record.
Market Insights

Advertisement
Community Narratives
MicroStrategy: Volatile Gamble or Golden Opportunity?
Fair Value US$663.00|31.9% undervalued
BL
Community Contributor
Emerging Markets and Debt Reduction Will Propel Bath & Body Works Forward
Fair Value US$40.73|22.1% undervalued
ZW
Community Contributor
An amazing opportunity to potentially get a 100 bagger
Fair Value US$10.00|36.0% overvalued
DA
Community Contributor