oOh!media Limited (ASX:OML) Not Lagging Market On Growth Or Pricing

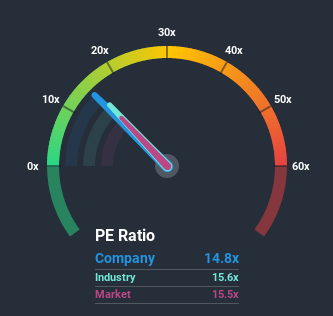
It's not a stretch to say that oOh!media Limited's (ASX:OML) price-to-earnings (or "P/E") ratio of 14.8x right now seems quite "middle-of-the-road" compared to the market in Australia, where the median P/E ratio is around 16x. However, investors might be overlooking a clear opportunity or potential setback if there is no rational basis for the P/E.
While the market has experienced earnings growth lately, oOh!media's earnings have gone into reverse gear, which is not great. It might be that many expect the dour earnings performance to strengthen positively, which has kept the P/E from falling. If not, then existing shareholders may be a little nervous about the viability of the share price.
See our latest analysis for oOh!media
How Does oOh!media's P/E Ratio Compare To Its Industry Peers?
An inspection of the typical P/E's throughout oOh!media's industry may help to explain its fairly average P/E ratio. It turns out the Media industry in general also has a P/E ratio similar to the market, as the graphic below shows. So this certainly goes a fair way towards explaining the company's ratio right now. In the context of the Media industry's current setting, most of its constituents' P/E's would be expected to be held back. Still, the strength of the company's earnings will most likely determine where its P/E shall sit.

How Is oOh!media's Growth Trending?
There's an inherent assumption that a company should be matching the market for P/E ratios like oOh!media's to be considered reasonable.
Retrospectively, the last year delivered a frustrating 61% decrease to the company's bottom line. The last three years don't look nice either as the company has shrunk EPS by 65% in aggregate. Accordingly, shareholders would have felt downbeat about the medium-term rates of earnings growth.
Looking ahead now, EPS is anticipated to climb by 12% per annum during the coming three years according to the five analysts following the company. That's shaping up to be similar to the 12% per year growth forecast for the broader market.
With this information, we can see why oOh!media is trading at a fairly similar P/E to the market. It seems most investors are expecting to see average future growth and are only willing to pay a moderate amount for the stock.
The Bottom Line On oOh!media's P/E
It's argued the price-to-earnings ratio is an inferior measure of value within certain industries, but it can be a powerful business sentiment indicator.
We've established that oOh!media maintains its moderate P/E off the back of its forecast growth being in line with the wider market, as expected. At this stage investors feel the potential for an improvement or deterioration in earnings isn't great enough to justify a high or low P/E ratio. It's hard to see the share price moving strongly in either direction in the near future under these circumstances.
You need to take note of risks, for example - oOh!media has 6 warning signs (and 2 which are significant) we think you should know about.
Of course, you might find a fantastic investment by looking at a few good candidates. So take a peek at this free list of companies with a strong growth track record, trading on a P/E below 20x.
When trading oOh!media or any other investment, use the platform considered by many to be the Professional's Gateway to the Worlds Market, Interactive Brokers. You get the lowest-cost* trading on stocks, options, futures, forex, bonds and funds worldwide from a single integrated account. Promoted
Valuation is complex, but we're here to simplify it.
Discover if oOh!media might be undervalued or overvalued with our detailed analysis, featuring fair value estimates, potential risks, dividends, insider trades, and its financial condition.
Access Free AnalysisThis article by Simply Wall St is general in nature. It does not constitute a recommendation to buy or sell any stock, and does not take account of your objectives, or your financial situation. We aim to bring you long-term focused analysis driven by fundamental data. Note that our analysis may not factor in the latest price-sensitive company announcements or qualitative material. Simply Wall St has no position in any stocks mentioned.
*Interactive Brokers Rated Lowest Cost Broker by StockBrokers.com Annual Online Review 2020
Have feedback on this article? Concerned about the content? Get in touch with us directly. Alternatively, email editorial-team@simplywallst.com.
About ASX:OML
oOh!media
Engages in the outdoor media, and production and advertising businesses in Australia and New Zealand.
Proven track record with moderate growth potential.
Similar Companies
Market Insights
Community Narratives


