
Advertisement
Market (ASX:MKT) Could Be Struggling To Allocate Capital

There are a few key trends to look for if we want to identify the next multi-bagger. In a perfect world, we'd like to see a company investing more capital into its business and ideally the returns earned from that capital are also increasing. Ultimately, this demonstrates that it's a business that is reinvesting profits at increasing rates of return. Having said that, from a first glance at Market (ASX:MKT) we aren't jumping out of our chairs at how returns are trending, but let's have a deeper look.
Understanding Return On Capital Employed (ROCE)
For those who don't know, ROCE is a measure of a company's yearly pre-tax profit (its return), relative to the capital employed in the business. Analysts use this formula to calculate it for Market:
Return on Capital Employed = Earnings Before Interest and Tax (EBIT) ÷ (Total Assets - Current Liabilities)
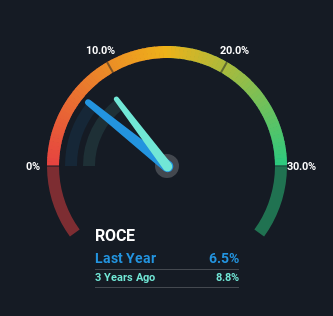
0.065 = AU$8.1m ÷ (AU$154m - AU$29m) (Based on the trailing twelve months to December 2023).
Therefore, Market has an ROCE of 6.5%. In absolute terms, that's a low return but it's around the Interactive Media and Services industry average of 8.0%.
View our latest analysis for Market
While the past is not representative of the future, it can be helpful to know how a company has performed historically, which is why we have this chart above. If you'd like to look at how Market has performed in the past in other metrics, you can view this free graph of Market's past earnings, revenue and cash flow.
What Can We Tell From Market's ROCE Trend?
In terms of Market's historical ROCE movements, the trend isn't fantastic. Over the last five years, returns on capital have decreased to 6.5% from 34% five years ago. Although, given both revenue and the amount of assets employed in the business have increased, it could suggest the company is investing in growth, and the extra capital has led to a short-term reduction in ROCE. And if the increased capital generates additional returns, the business, and thus shareholders, will benefit in the long run.
On a side note, Market has done well to pay down its current liabilities to 19% of total assets. So we could link some of this to the decrease in ROCE. Effectively this means their suppliers or short-term creditors are funding less of the business, which reduces some elements of risk. Some would claim this reduces the business' efficiency at generating ROCE since it is now funding more of the operations with its own money.
Our Take On Market's ROCE
Even though returns on capital have fallen in the short term, we find it promising that revenue and capital employed have both increased for Market. These trends are starting to be recognized by investors since the stock has delivered a 10% gain to shareholders who've held over the last five years. Therefore we'd recommend looking further into this stock to confirm if it has the makings of a good investment.
Since virtually every company faces some risks, it's worth knowing what they are, and we've spotted 3 warning signs for Market (of which 2 can't be ignored!) that you should know about.
While Market may not currently earn the highest returns, we've compiled a list of companies that currently earn more than 25% return on equity. Check out this free list here.
New: Manage All Your Stock Portfolios in One Place
We've created the ultimate portfolio companion for stock investors, and it's free.
• Connect an unlimited number of Portfolios and see your total in one currency
• Be alerted to new Warning Signs or Risks via email or mobile
• Track the Fair Value of your stocks
Have feedback on this article? Concerned about the content? Get in touch with us directly. Alternatively, email editorial-team (at) simplywallst.com.
This article by Simply Wall St is general in nature. We provide commentary based on historical data and analyst forecasts only using an unbiased methodology and our articles are not intended to be financial advice. It does not constitute a recommendation to buy or sell any stock, and does not take account of your objectives, or your financial situation. We aim to bring you long-term focused analysis driven by fundamental data. Note that our analysis may not factor in the latest price-sensitive company announcements or qualitative material. Simply Wall St has no position in any stocks mentioned.
Have feedback on this article? Concerned about the content? Get in touch with us directly. Alternatively, email editorial-team@simplywallst.com
About ASX:GUM
Gumtree Australia Markets
Operates a digital business news and investor relations platform in Australia and internationally.
Slight and slightly overvalued.
Similar Companies
Market Insights

Advertisement
Community Narratives
WhiteCap Is Positioned To Profit Regardless Of Trump's Policy 
Fair Value CA$22.60|61.7% undervalued
ST
Equity Analyst and Writer
Microsoft's Evolution Will Drive Revenue to New Heights Fueled by AI
Fair Value US$360.00|28.9% overvalued
BR
Community Contributor
A CASE FOR USD$2.50 (CAD$3.44) BY 2028 (A 5-10 BAGGER)
Fair Value CA$3.44|88.1% undervalued
AG
Community Contributor