
Advertisement
Love Group Global Ltd's (ASX:LVE) Stock Has Been Sliding But Fundamentals Look Strong: Is The Market Wrong?
It is hard to get excited after looking at Love Group Global's (ASX:LVE) recent performance, when its stock has declined 15% over the past week. However, a closer look at its sound financials might cause you to think again. Given that fundamentals usually drive long-term market outcomes, the company is worth looking at. In this article, we decided to focus on Love Group Global's ROE.
Return on equity or ROE is an important factor to be considered by a shareholder because it tells them how effectively their capital is being reinvested. Simply put, it is used to assess the profitability of a company in relation to its equity capital.
How To Calculate Return On Equity?
ROE can be calculated by using the formula:
Return on Equity = Net Profit (from continuing operations) ÷ Shareholders' Equity
So, based on the above formula, the ROE for Love Group Global is:
63% = AU$849k ÷ AU$1.4m (Based on the trailing twelve months to June 2025).
The 'return' is the income the business earned over the last year. So, this means that for every A$1 of its shareholder's investments, the company generates a profit of A$0.63.
Check out our latest analysis for Love Group Global
What Is The Relationship Between ROE And Earnings Growth?
We have already established that ROE serves as an efficient profit-generating gauge for a company's future earnings. Based on how much of its profits the company chooses to reinvest or "retain", we are then able to evaluate a company's future ability to generate profits. Assuming everything else remains unchanged, the higher the ROE and profit retention, the higher the growth rate of a company compared to companies that don't necessarily bear these characteristics.
Love Group Global's Earnings Growth And 63% ROE
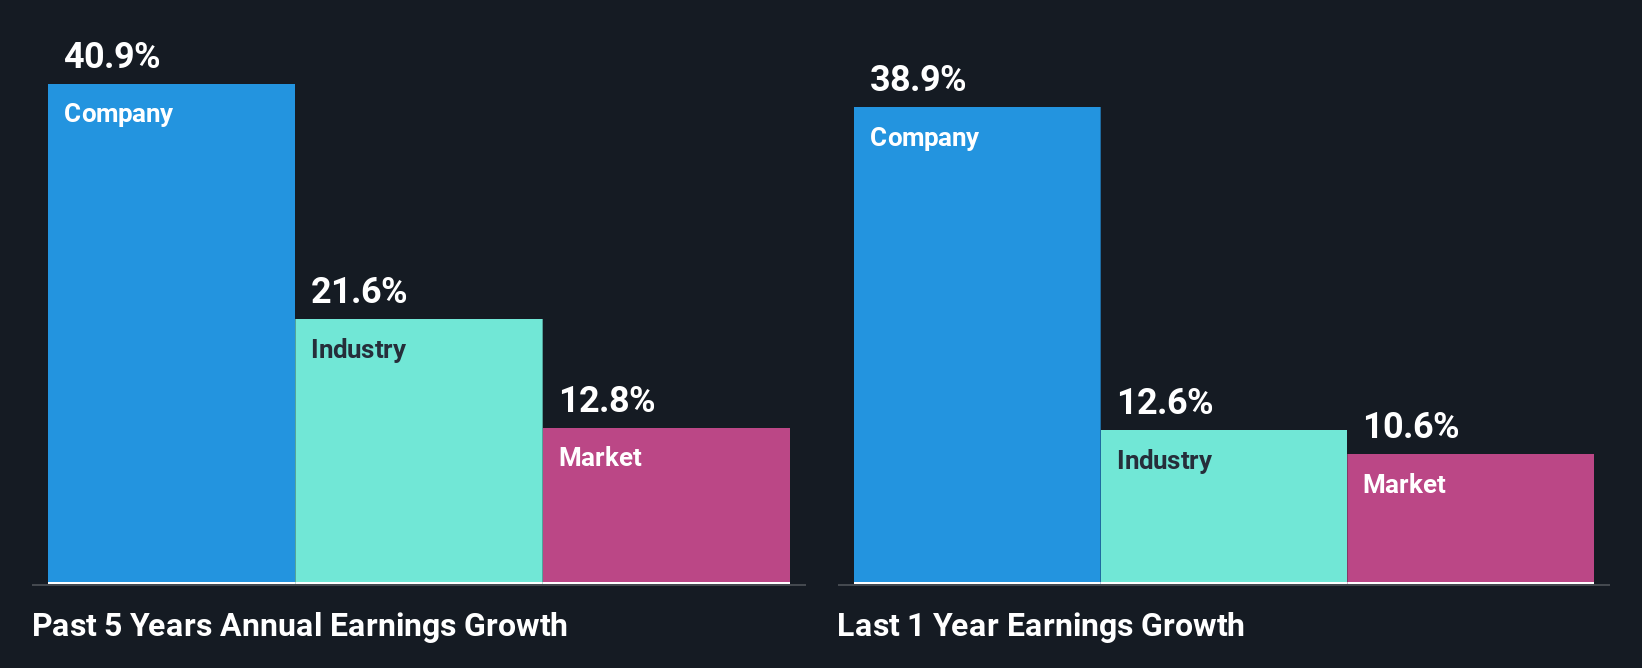
Firstly, we acknowledge that Love Group Global has a significantly high ROE. Additionally, the company's ROE is higher compared to the industry average of 9.6% which is quite remarkable. As a result, Love Group Global's exceptional 41% net income growth seen over the past five years, doesn't come as a surprise.
Next, on comparing with the industry net income growth, we found that Love Group Global's growth is quite high when compared to the industry average growth of 22% in the same period, which is great to see.
Earnings growth is a huge factor in stock valuation. The investor should try to establish if the expected growth or decline in earnings, whichever the case may be, is priced in. This then helps them determine if the stock is placed for a bright or bleak future. One good indicator of expected earnings growth is the P/E ratio which determines the price the market is willing to pay for a stock based on its earnings prospects. So, you may want to check if Love Group Global is trading on a high P/E or a low P/E, relative to its industry.
Is Love Group Global Using Its Retained Earnings Effectively?
Conclusion
Overall, we are quite pleased with Love Group Global's performance. In particular, it's great to see that the company is investing heavily into its business and along with a high rate of return, that has resulted in a sizeable growth in its earnings. If the company continues to grow its earnings the way it has, that could have a positive impact on its share price given how earnings per share influence long-term share prices. Not to forget, share price outcomes are also dependent on the potential risks a company may face. So it is important for investors to be aware of the risks involved in the business. You can see the 3 risks we have identified for Love Group Global by visiting our risks dashboard for free on our platform here.
New: AI Stock Screener & Alerts
Our new AI Stock Screener scans the market every day to uncover opportunities.
• Dividend Powerhouses (3%+ Yield)
• Undervalued Small Caps with Insider Buying
• High growth Tech and AI Companies
Or build your own from over 50 metrics.
Have feedback on this article? Concerned about the content? Get in touch with us directly. Alternatively, email editorial-team (at) simplywallst.com.
This article by Simply Wall St is general in nature. We provide commentary based on historical data and analyst forecasts only using an unbiased methodology and our articles are not intended to be financial advice. It does not constitute a recommendation to buy or sell any stock, and does not take account of your objectives, or your financial situation. We aim to bring you long-term focused analysis driven by fundamental data. Note that our analysis may not factor in the latest price-sensitive company announcements or qualitative material. Simply Wall St has no position in any stocks mentioned.
About ASX:LVE
Love Group Global
Provides social and dating products and services in Asia, Europe, Singapore, and Bangkok.
Flawless balance sheet with solid track record.
Market Insights

Advertisement
Community Narratives
The company that turned a verb into a global necessity and basically runs the modern internet, digital ads, smartphones, maps, and AI.
Fair Value US$300.00|10.8% undervalued
OS
Community Contributor
Flowers Foods Pays A Fair Price For Health
Fair Value US$16.12|22.0% undervalued
NV
Community Contributor
TMX Group will thrive with 33.3% profit margin and enduring market moat
Fair Value CA$49.90|3.8% overvalued
LI
Community Contributor