
Advertisement
- Australia
- /
- Entertainment
- /
- ASX:ICI
Slammed 27% iCandy Interactive Limited (ASX:ICI) Screens Well Here But There Might Be A Catch

iCandy Interactive Limited (ASX:ICI) shares have had a horrible month, losing 27% after a relatively good period beforehand. Instead of being rewarded, shareholders who have already held through the last twelve months are now sitting on a 35% share price drop.
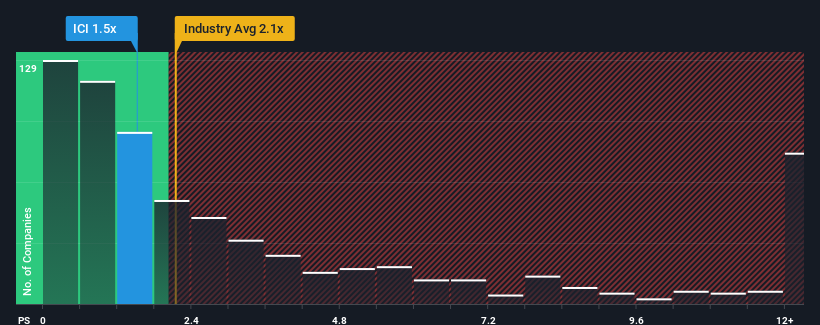
Even after such a large drop in price, you could still be forgiven for feeling indifferent about iCandy Interactive's P/S ratio of 1.5x, since the median price-to-sales (or "P/S") ratio for the Entertainment industry in Australia is also close to 1.8x. However, investors might be overlooking a clear opportunity or potential setback if there is no rational basis for the P/S.
See our latest analysis for iCandy Interactive
How iCandy Interactive Has Been Performing
Recent times have been quite advantageous for iCandy Interactive as its revenue has been rising very briskly. Perhaps the market is expecting future revenue performance to taper off, which has kept the P/S from rising. Those who are bullish on iCandy Interactive will be hoping that this isn't the case, so that they can pick up the stock at a lower valuation.
We don't have analyst forecasts, but you can see how recent trends are setting up the company for the future by checking out our free report on iCandy Interactive's earnings, revenue and cash flow.Is There Some Revenue Growth Forecasted For iCandy Interactive?
There's an inherent assumption that a company should be matching the industry for P/S ratios like iCandy Interactive's to be considered reasonable.
If we review the last year of revenue growth, the company posted a terrific increase of 55%. This great performance means it was also able to deliver immense revenue growth over the last three years. Accordingly, shareholders would have been over the moon with those medium-term rates of revenue growth.
Comparing that to the industry, which is only predicted to deliver 12% growth in the next 12 months, the company's momentum is stronger based on recent medium-term annualised revenue results.
With this information, we find it interesting that iCandy Interactive is trading at a fairly similar P/S compared to the industry. It may be that most investors are not convinced the company can maintain its recent growth rates.
What Does iCandy Interactive's P/S Mean For Investors?
Following iCandy Interactive's share price tumble, its P/S is just clinging on to the industry median P/S. It's argued the price-to-sales ratio is an inferior measure of value within certain industries, but it can be a powerful business sentiment indicator.
To our surprise, iCandy Interactive revealed its three-year revenue trends aren't contributing to its P/S as much as we would have predicted, given they look better than current industry expectations. There could be some unobserved threats to revenue preventing the P/S ratio from matching this positive performance. While recent revenue trends over the past medium-term suggest that the risk of a price decline is low, investors appear to see the likelihood of revenue fluctuations in the future.
We don't want to rain on the parade too much, but we did also find 5 warning signs for iCandy Interactive (2 can't be ignored!) that you need to be mindful of.
If companies with solid past earnings growth is up your alley, you may wish to see this free collection of other companies with strong earnings growth and low P/E ratios.
Valuation is complex, but we're here to simplify it.
Discover if iCandy Interactive might be undervalued or overvalued with our detailed analysis, featuring fair value estimates, potential risks, dividends, insider trades, and its financial condition.
Access Free AnalysisHave feedback on this article? Concerned about the content? Get in touch with us directly. Alternatively, email editorial-team (at) simplywallst.com.
This article by Simply Wall St is general in nature. We provide commentary based on historical data and analyst forecasts only using an unbiased methodology and our articles are not intended to be financial advice. It does not constitute a recommendation to buy or sell any stock, and does not take account of your objectives, or your financial situation. We aim to bring you long-term focused analysis driven by fundamental data. Note that our analysis may not factor in the latest price-sensitive company announcements or qualitative material. Simply Wall St has no position in any stocks mentioned.
About ASX:ICI
iCandy Interactive
Designs, develops, and publishes mobile games and digital entertainment in Australia, Singapore, Malaysia, Indonesia, and Europe.
Flawless balance sheet low.
Market Insights

Advertisement
Community Narratives
Pinterest will surge as advertising innovations ignite revenue growth
Fair Value US$42.63|27.1% undervalued
BR
Community Contributor
Brambles' Revenue Set to Climb 14% with Profit Margins Following
Fair Value AU$21.90|5.9% overvalued
RO
Community Contributor
Challenging Future for STG as Organic Sales Decline by 8.8%
Fair Value DKK 116.13|26.8% undervalued
KA
Community Contributor