
In order to justify the effort of selecting individual stocks, it's worth striving to beat the returns from a market index fund. But even the best stock picker will only win with some selections. So we wouldn't blame long term HT&E Limited (ASX:HT1) shareholders for doubting their decision to hold, with the stock down 61% over a half decade. Even worse, it's down 13% in about a month, which isn't fun at all. This could be related to the recent financial results - you can catch up on the most recent data by reading our company report.
See our latest analysis for HT&E
In his essay The Superinvestors of Graham-and-Doddsville Warren Buffett described how share prices do not always rationally reflect the value of a business. One flawed but reasonable way to assess how sentiment around a company has changed is to compare the earnings per share (EPS) with the share price.
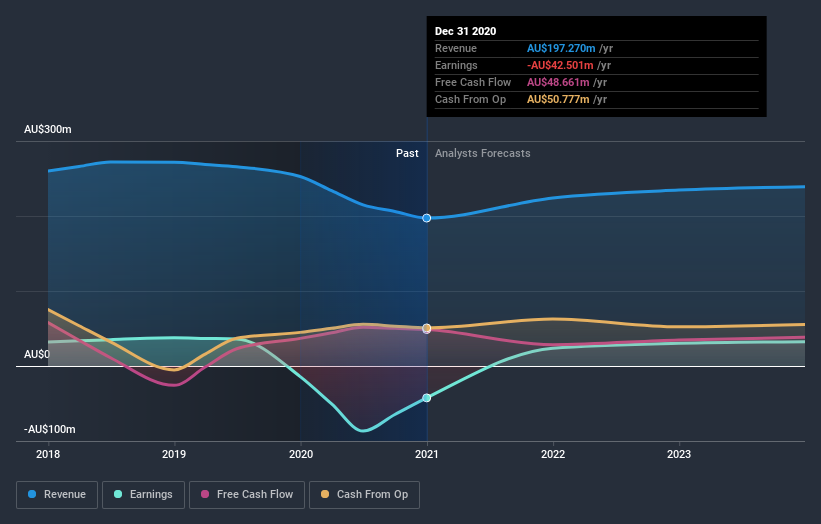
We know that HT&E has been profitable in the past. On the other hand, it reported a trailing twelve months loss, suggesting it isn't reliably profitable. Other metrics may better explain the share price move.
It could be that the revenue decline of 4.9% per year is viewed as evidence that HT&E is shrinking. That could explain the weak share price.
The graphic below depicts how earnings and revenue have changed over time (unveil the exact values by clicking on the image).
You can see how its balance sheet has strengthened (or weakened) over time in this free interactive graphic.
What about the Total Shareholder Return (TSR)?
Investors should note that there's a difference between HT&E's total shareholder return (TSR) and its share price change, which we've covered above. The TSR is a return calculation that accounts for the value of cash dividends (assuming that any dividend received was reinvested) and the calculated value of any discounted capital raisings and spin-offs. Dividends have been really beneficial for HT&E shareholders, and that cash payout explains why its total shareholder loss of 33%, over the last 5 years, isn't as bad as the share price return.
A Different Perspective
It's good to see that HT&E has rewarded shareholders with a total shareholder return of 59% in the last twelve months. Notably the five-year annualised TSR loss of 6% per year compares very unfavourably with the recent share price performance. We generally put more weight on the long term performance over the short term, but the recent improvement could hint at a (positive) inflection point within the business. You might want to assess this data-rich visualization of its earnings, revenue and cash flow.
Of course HT&E may not be the best stock to buy. So you may wish to see this free collection of growth stocks.
Please note, the market returns quoted in this article reflect the market weighted average returns of stocks that currently trade on AU exchanges.
When trading HT&E or any other investment, use the platform considered by many to be the Professional's Gateway to the Worlds Market, Interactive Brokers. You get the lowest-cost* trading on stocks, options, futures, forex, bonds and funds worldwide from a single integrated account. Promoted
Mobile Infrastructure for Defense and Disaster
The next wave in robotics isn't humanoid. Its fully autonomous towers delivering 5G, ISR, and radar in under 30 minutes, anywhere.
Get the investor briefing before the next round of contracts
Sponsored On Behalf of CiTechNew: Manage All Your Stock Portfolios in One Place
We've created the ultimate portfolio companion for stock investors, and it's free.
• Connect an unlimited number of Portfolios and see your total in one currency
• Be alerted to new Warning Signs or Risks via email or mobile
• Track the Fair Value of your stocks
This article by Simply Wall St is general in nature. It does not constitute a recommendation to buy or sell any stock, and does not take account of your objectives, or your financial situation. We aim to bring you long-term focused analysis driven by fundamental data. Note that our analysis may not factor in the latest price-sensitive company announcements or qualitative material. Simply Wall St has no position in any stocks mentioned.
*Interactive Brokers Rated Lowest Cost Broker by StockBrokers.com Annual Online Review 2020
Have feedback on this article? Concerned about the content? Get in touch with us directly. Alternatively, email editorial-team (at) simplywallst.com.
About ASX:A1N
ARN Media
Operates as a media and entertainment company in Australia and Hong Kong.
Very undervalued with adequate balance sheet.
Similar Companies
Market Insights

Weekly Picks

Early mover in a fast growing industry. Likely to experience share price volatility as they scale


A case for CA$31.80 (undiluted), aka 8,616% upside from CA$0.37 (an 86 bagger!).


Moderation and Stabilisation: HOLD: Fair Price based on a 4-year Cycle is $12.08
Recently Updated Narratives


Title: Market Sentiment Is Dead Wrong — Here's Why PSEC Deserves a Second Look


An amazing opportunity to potentially get a 100 bagger

Amazon: Why the World’s Biggest Platform Still Runs on Invisible Economics
Popular Narratives


MicroVision will explode future revenue by 380.37% with a vision towards success


Crazy Undervalued 42 Baggers Silver Play (Active & Running Mine)


NVDA: Expanding AI Demand Will Drive Major Data Center Investments Through 2026
Trending Discussion
