- Australia
- /
- Metals and Mining
- /
- ASX:MYE
GWA Group And 2 Other Exciting Penny Stocks On The ASX

Reviewed by Simply Wall St

As the Australian market holds steady with the ASX200 trading flat at 8,210 points, investors are keenly watching upcoming economic indicators and international events. In such a climate, penny stocks—though a somewhat outdated term—remain an intriguing option for those seeking potential value in smaller or newer companies. By focusing on those with strong financials and growth potential, investors may uncover opportunities that larger firms might overlook.
Top 10 Penny Stocks In Australia
| Name | Share Price | Market Cap | Financial Health Rating |
| LaserBond (ASX:LBL) | A$0.62 | A$72.68M | ★★★★★★ |
| Embark Early Education (ASX:EVO) | A$0.80 | A$127.64M | ★★★★☆☆ |
| Helloworld Travel (ASX:HLO) | A$1.78 | A$286.72M | ★★★★★★ |
| MaxiPARTS (ASX:MXI) | A$1.895 | A$104.82M | ★★★★★★ |
| Austin Engineering (ASX:ANG) | A$0.57 | A$353.48M | ★★★★★☆ |
| Navigator Global Investments (ASX:NGI) | A$1.685 | A$825.78M | ★★★★★☆ |
| GTN (ASX:GTN) | A$0.47 | A$92.11M | ★★★★★★ |
| Joyce (ASX:JYC) | A$3.98 | A$117.4M | ★★★★★★ |
| EZZ Life Science Holdings (ASX:EZZ) | A$3.40 | A$151.04M | ★★★★★★ |
| Atlas Pearls (ASX:ATP) | A$0.13 | A$56.64M | ★★★★★★ |
Click here to see the full list of 1,028 stocks from our ASX Penny Stocks screener.
Here's a peek at a few of the choices from the screener.
GWA Group (ASX:GWA)
Simply Wall St Financial Health Rating: ★★★★★☆
Overview: GWA Group Limited is involved in the research, design, manufacture, importation, and marketing of building fixtures and fittings for residential and commercial properties across Australia, New Zealand, and international markets with a market cap of A$641.80 million.
Operations: The company generates revenue from its Water Solutions segment, which reported A$413.49 million.
Market Cap: A$641.8M
GWA Group Limited, with a market cap of A$641.80 million, operates in the building fixtures sector and has shown mixed performance indicators relevant to penny stock investors. The company's revenue from its Water Solutions segment was A$413.49 million, but recent earnings growth has been negative at -10.5%. Despite this, GWA's debt management is strong with a reduced debt-to-equity ratio and interest well-covered by EBIT. Short-term assets exceed liabilities; however, long-term liabilities are not fully covered by short-term assets. The dividend yield of 6.61% is not well supported by earnings, raising concerns about sustainability amidst declining profit margins and executive changes on the horizon.
- Click to explore a detailed breakdown of our findings in GWA Group's financial health report.
- Gain insights into GWA Group's future direction by reviewing our growth report.

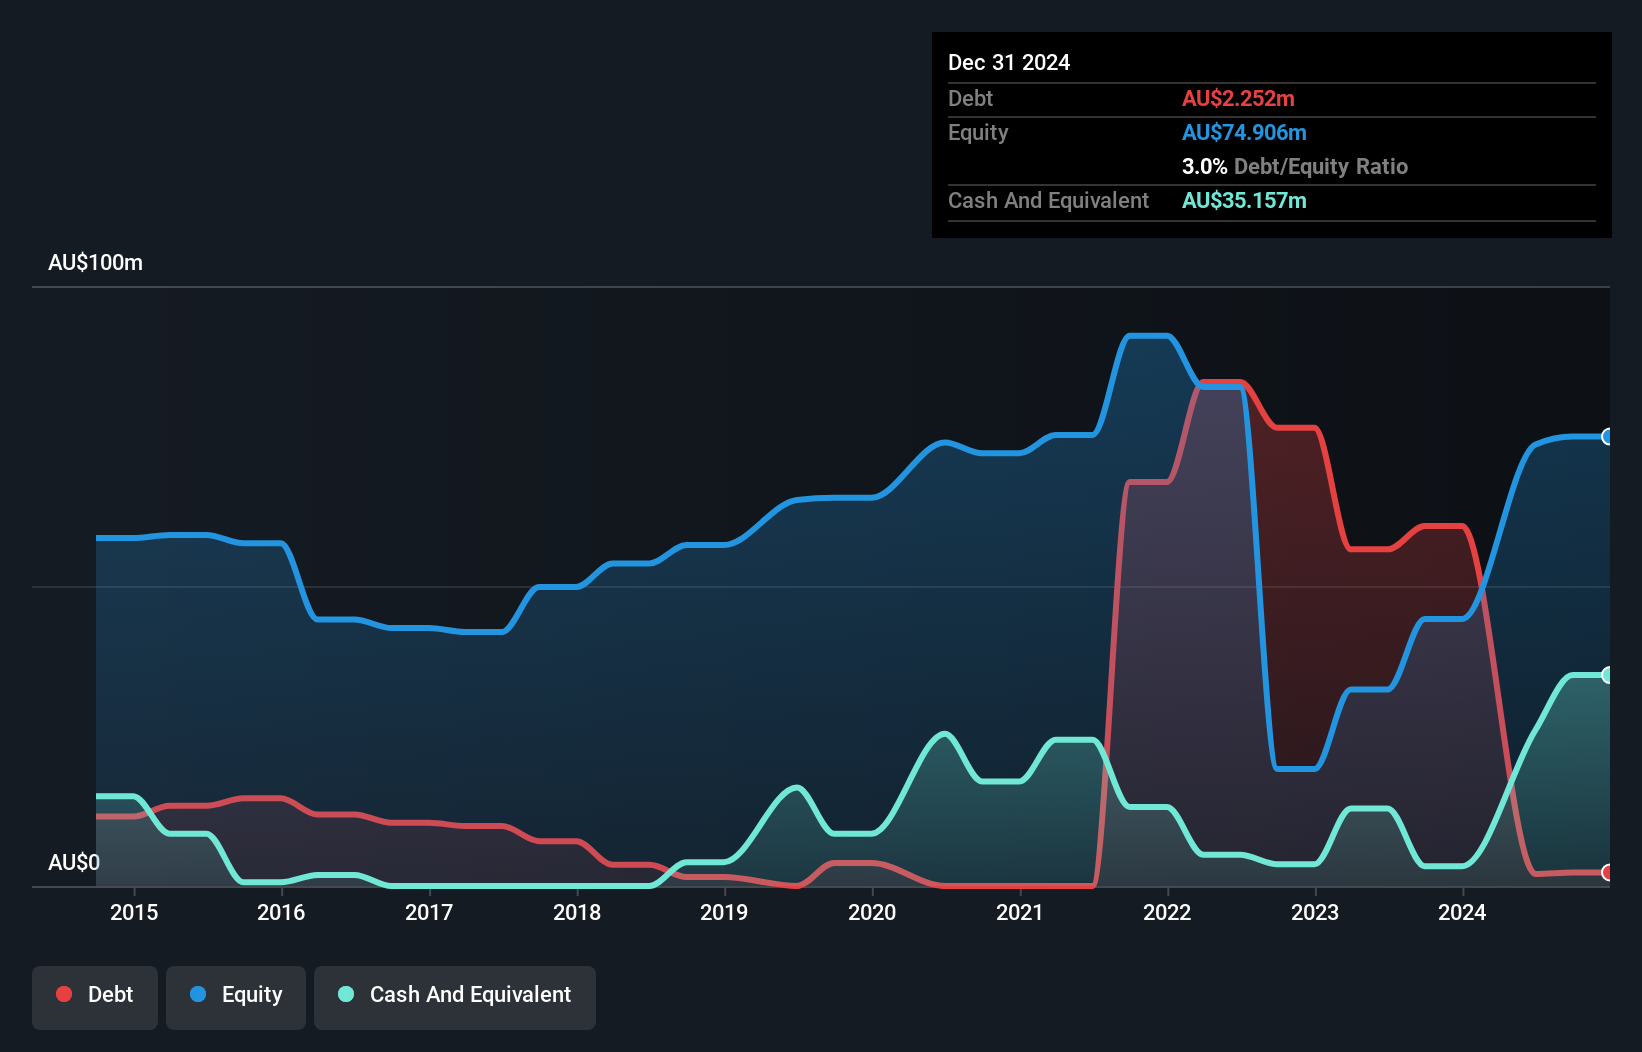
Metarock Group (ASX:MYE)
Simply Wall St Financial Health Rating: ★★★★★☆
Overview: Metarock Group Limited offers mine operation, contracting, training, and related services within the mining and supporting industries in Australia with a market cap of A$55.61 million.
Operations: The company's revenue is primarily derived from its Mastermyne segment, which generated A$294.39 million.
Market Cap: A$55.61M
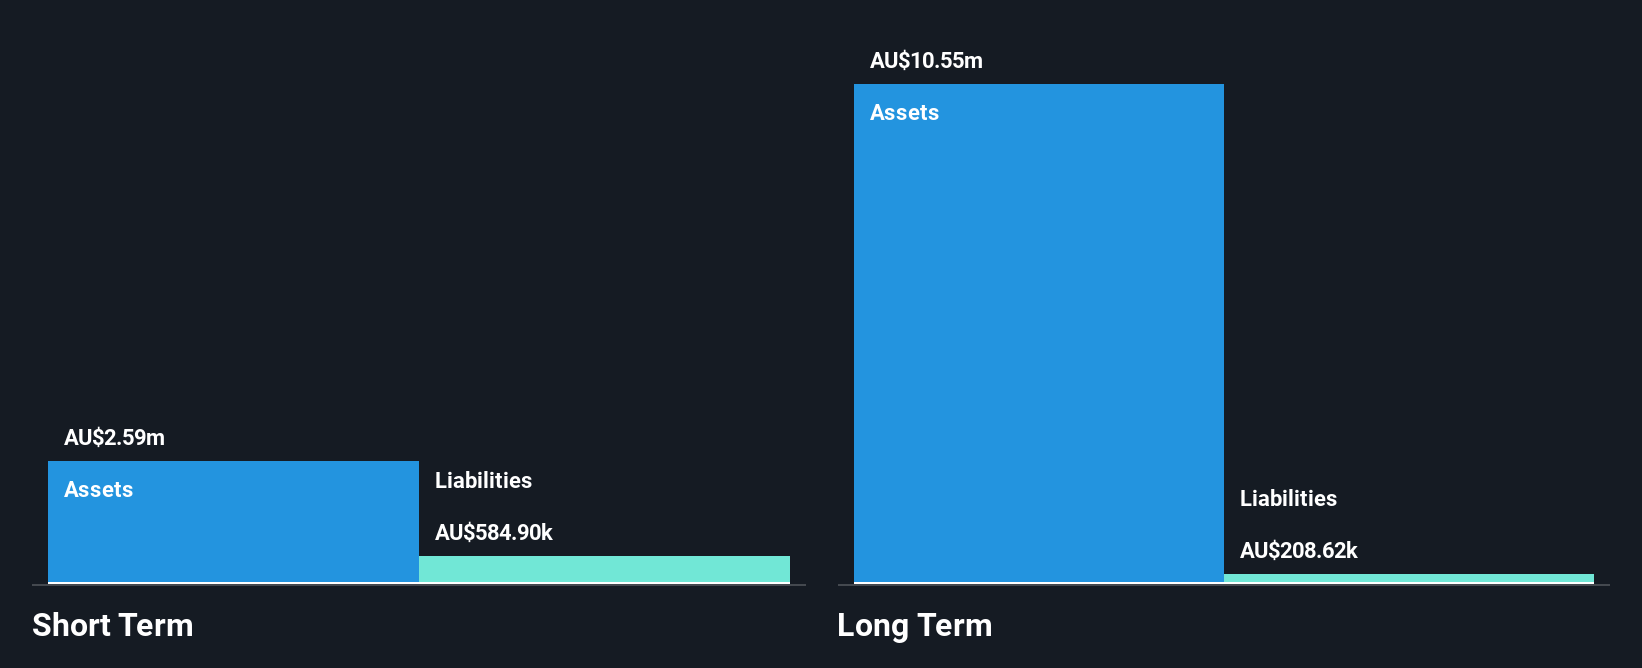
Metarock Group Limited, with a market cap of A$55.61 million, has recently seen significant executive changes following the divestment of PYBAR. The company’s financial health appears robust, as short-term assets exceed both short and long-term liabilities, and its debt is well covered by operating cash flow. Metarock's profitability improved markedly over the past year with net income reaching A$39.64 million from a previous loss, although this was influenced by a large one-off gain. Despite these positives, the board's inexperience could be a concern for investors seeking stability in management amidst ongoing contract negotiations and M&A pursuits.
- Get an in-depth perspective on Metarock Group's performance by reading our balance sheet health report here.
- Understand Metarock Group's track record by examining our performance history report.
Zeotech (ASX:ZEO)
Simply Wall St Financial Health Rating: ★★★★☆☆
Overview: Zeotech Limited is an Australian mineral processing technology company with a market cap of A$60.96 million.
Operations: The company generated A$0.78 million in revenue from its exploration segment.
Market Cap: A$60.96M
Zeotech Limited, with a market cap of A$60.96 million, is currently pre-revenue with A$0.78 million generated from its exploration segment. The company remains debt-free and has short-term assets of A$2.3 million surpassing both short and long-term liabilities, indicating a solid financial position despite less than a year of cash runway based on current free cash flow trends. Recent management changes include the appointment of James Marsh as CEO to enhance strategic execution in the industrial minerals sector, particularly for high reactivity metakaolin production. However, shareholders faced dilution due to recent equity offerings totaling A$1.82 million.
- Unlock comprehensive insights into our analysis of Zeotech stock in this financial health report.
- Explore historical data to track Zeotech's performance over time in our past results report.
Taking Advantage
- Gain an insight into the universe of 1,028 ASX Penny Stocks by clicking here.
- Have a stake in these businesses? Integrate your holdings into Simply Wall St's portfolio for notifications and detailed stock reports.
- Take control of your financial future using Simply Wall St, offering free, in-depth knowledge of international markets to every investor.
Ready For A Different Approach?
- Explore high-performing small cap companies that haven't yet garnered significant analyst attention.
- Jump on the AI train with fast growing tech companies forging a new era of innovation.
- Find companies with promising cash flow potential yet trading below their fair value.
This article by Simply Wall St is general in nature. We provide commentary based on historical data and analyst forecasts only using an unbiased methodology and our articles are not intended to be financial advice. It does not constitute a recommendation to buy or sell any stock, and does not take account of your objectives, or your financial situation. We aim to bring you long-term focused analysis driven by fundamental data. Note that our analysis may not factor in the latest price-sensitive company announcements or qualitative material. Simply Wall St has no position in any stocks mentioned.
New: Manage All Your Stock Portfolios in One Place
We've created the ultimate portfolio companion for stock investors, and it's free.
• Connect an unlimited number of Portfolios and see your total in one currency
• Be alerted to new Warning Signs or Risks via email or mobile
• Track the Fair Value of your stocks
Have feedback on this article? Concerned about the content? Get in touch with us directly. Alternatively, email editorial-team@simplywallst.com
About ASX:MYE
Mastermyne Group
Provides mine operation, contracting, training, and related services in the mining and supporting industries in Australia.
Flawless balance sheet, good value and pays a dividend.
Similar Companies
Market Insights

Community Narratives

