

The external fund manager backed by Berkshire Hathaway's Charlie Munger, Li Lu, makes no bones about it when he says 'The biggest investment risk is not the volatility of prices, but whether you will suffer a permanent loss of capital.' When we think about how risky a company is, we always like to look at its use of debt, since debt overload can lead to ruin. We note that True North Copper Limited (ASX:TNC) does have debt on its balance sheet. But should shareholders be worried about its use of debt?
When Is Debt Dangerous?
Debt and other liabilities become risky for a business when it cannot easily fulfill those obligations, either with free cash flow or by raising capital at an attractive price. In the worst case scenario, a company can go bankrupt if it cannot pay its creditors. However, a more common (but still painful) scenario is that it has to raise new equity capital at a low price, thus permanently diluting shareholders. Having said that, the most common situation is where a company manages its debt reasonably well - and to its own advantage. When we think about a company's use of debt, we first look at cash and debt together.
See our latest analysis for True North Copper
How Much Debt Does True North Copper Carry?
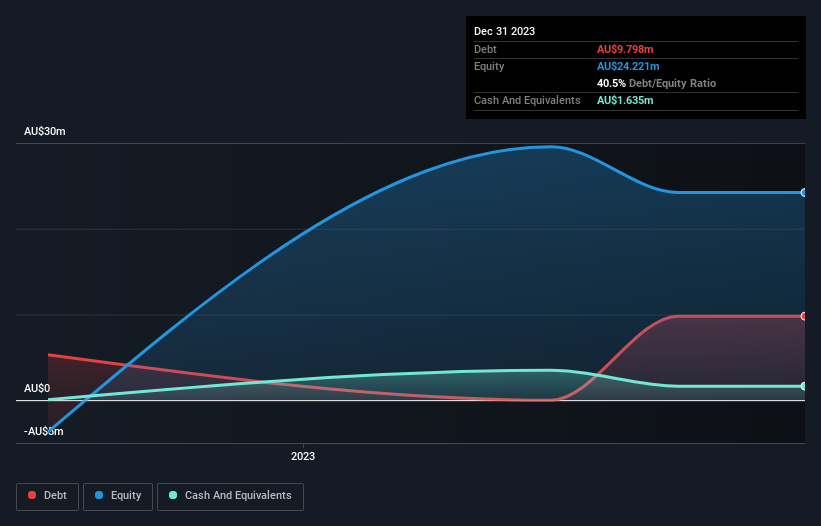
You can click the graphic below for the historical numbers, but it shows that as of December 2023 True North Copper had AU$9.80m of debt, an increase on none, over one year. However, it also had AU$1.64m in cash, and so its net debt is AU$8.16m.
A Look At True North Copper's Liabilities
We can see from the most recent balance sheet that True North Copper had liabilities of AU$20.3m falling due within a year, and liabilities of AU$33.1m due beyond that. Offsetting this, it had AU$1.64m in cash and AU$706.4k in receivables that were due within 12 months. So it has liabilities totalling AU$51.1m more than its cash and near-term receivables, combined.
This is a mountain of leverage relative to its market capitalization of AU$61.1m. Should its lenders demand that it shore up the balance sheet, shareholders would likely face severe dilution. There's no doubt that we learn most about debt from the balance sheet. But it is True North Copper's earnings that will influence how the balance sheet holds up in the future. So if you're keen to discover more about its earnings, it might be worth checking out this graph of its long term earnings trend.
Over 12 months, True North Copper reported revenue of AU$1.8m, which is a gain of 143%, although it did not report any earnings before interest and tax. So there's no doubt that shareholders are cheering for growth
Caveat Emptor
While we can certainly appreciate True North Copper's revenue growth, its earnings before interest and tax (EBIT) loss is not ideal. Indeed, it lost a very considerable AU$16m at the EBIT level. When we look at that and recall the liabilities on its balance sheet, relative to cash, it seems unwise to us for the company to have any debt. So we think its balance sheet is a little strained, though not beyond repair. However, it doesn't help that it burned through AU$29m of cash over the last year. So in short it's a really risky stock. The balance sheet is clearly the area to focus on when you are analysing debt. However, not all investment risk resides within the balance sheet - far from it. To that end, you should learn about the 5 warning signs we've spotted with True North Copper (including 2 which are a bit unpleasant) .
If you're interested in investing in businesses that can grow profits without the burden of debt, then check out this free list of growing businesses that have net cash on the balance sheet.
If you're looking to trade True North Copper, open an account with the lowest-cost platform trusted by professionals, Interactive Brokers.
With clients in over 200 countries and territories, and access to 160 markets, IBKR lets you trade stocks, options, futures, forex, bonds and funds from a single integrated account.
Enjoy no hidden fees, no account minimums, and FX conversion rates as low as 0.03%, far better than what most brokers offer.
Sponsored ContentValuation is complex, but we're here to simplify it.
Discover if True North Copper might be undervalued or overvalued with our detailed analysis, featuring fair value estimates, potential risks, dividends, insider trades, and its financial condition.
Access Free AnalysisHave feedback on this article? Concerned about the content? Get in touch with us directly. Alternatively, email editorial-team (at) simplywallst.com.
This article by Simply Wall St is general in nature. We provide commentary based on historical data and analyst forecasts only using an unbiased methodology and our articles are not intended to be financial advice. It does not constitute a recommendation to buy or sell any stock, and does not take account of your objectives, or your financial situation. We aim to bring you long-term focused analysis driven by fundamental data. Note that our analysis may not factor in the latest price-sensitive company announcements or qualitative material. Simply Wall St has no position in any stocks mentioned.
About ASX:TNC
True North Copper
Engages in mineral exploration and development activities in Australia.
Medium-low with adequate balance sheet.
Similar Companies
Market Insights

Community Narratives

