
Advertisement
- Australia
- /
- Metals and Mining
- /
- ASX:RMS
Ramelius Resources Limited (ASX:RMS) Is Going Strong But Fundamentals Appear To Be Mixed : Is There A Clear Direction For The Stock?
Ramelius Resources (ASX:RMS) has had a great run on the share market with its stock up by a significant 27% over the last three months. But the company's key financial indicators appear to be differing across the board and that makes us question whether or not the company's current share price momentum can be maintained. Particularly, we will be paying attention to Ramelius Resources' ROE today.
ROE or return on equity is a useful tool to assess how effectively a company can generate returns on the investment it received from its shareholders. In simpler terms, it measures the profitability of a company in relation to shareholder's equity.
See our latest analysis for Ramelius Resources
How Do You Calculate Return On Equity?
The formula for ROE is:
Return on Equity = Net Profit (from continuing operations) ÷ Shareholders' Equity
So, based on the above formula, the ROE for Ramelius Resources is:
6.5% = AU$62m ÷ AU$940m (Based on the trailing twelve months to June 2023).
The 'return' is the income the business earned over the last year. That means that for every A$1 worth of shareholders' equity, the company generated A$0.07 in profit.
What Is The Relationship Between ROE And Earnings Growth?
We have already established that ROE serves as an efficient profit-generating gauge for a company's future earnings. Based on how much of its profits the company chooses to reinvest or "retain", we are then able to evaluate a company's future ability to generate profits. Generally speaking, other things being equal, firms with a high return on equity and profit retention, have a higher growth rate than firms that don’t share these attributes.
Ramelius Resources' Earnings Growth And 6.5% ROE
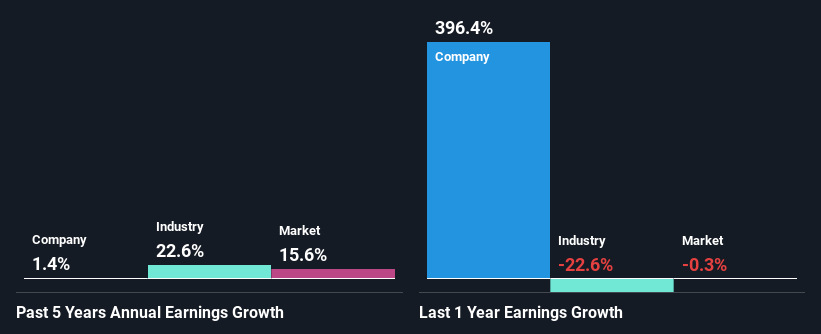
At first glance, Ramelius Resources' ROE doesn't look very promising. A quick further study shows that the company's ROE doesn't compare favorably to the industry average of 10% either. Therefore, Ramelius Resources' flat earnings over the past five years can possibly be explained by the low ROE amongst other factors.
As a next step, we compared Ramelius Resources' net income growth with the industry and were disappointed to see that the company's growth is lower than the industry average growth of 23% in the same period.
Earnings growth is a huge factor in stock valuation. The investor should try to establish if the expected growth or decline in earnings, whichever the case may be, is priced in. By doing so, they will have an idea if the stock is headed into clear blue waters or if swampy waters await. If you're wondering about Ramelius Resources''s valuation, check out this gauge of its price-to-earnings ratio, as compared to its industry.
Is Ramelius Resources Making Efficient Use Of Its Profits?
Ramelius Resources' low three-year median payout ratio of 16%, (meaning the company retains84% of profits) should mean that the company is retaining most of its earnings and consequently, should see higher growth than it has reported.
Additionally, Ramelius Resources has paid dividends over a period of four years, which means that the company's management is determined to pay dividends even if it means little to no earnings growth. Our latest analyst data shows that the future payout ratio of the company is expected to rise to 21% over the next three years. However, the company's ROE is not expected to change by much despite the higher expected payout ratio.
Summary
In total, we're a bit ambivalent about Ramelius Resources' performance. While the company does have a high rate of profit retention, its low rate of return is probably hampering its earnings growth. That being so, the latest analyst forecasts show that the company will continue to see an expansion in its earnings. To know more about the company's future earnings growth forecasts take a look at this free report on analyst forecasts for the company to find out more.
New: AI Stock Screener & Alerts
Our new AI Stock Screener scans the market every day to uncover opportunities.
• Dividend Powerhouses (3%+ Yield)
• Undervalued Small Caps with Insider Buying
• High growth Tech and AI Companies
Or build your own from over 50 metrics.
Have feedback on this article? Concerned about the content? Get in touch with us directly. Alternatively, email editorial-team (at) simplywallst.com.
This article by Simply Wall St is general in nature. We provide commentary based on historical data and analyst forecasts only using an unbiased methodology and our articles are not intended to be financial advice. It does not constitute a recommendation to buy or sell any stock, and does not take account of your objectives, or your financial situation. We aim to bring you long-term focused analysis driven by fundamental data. Note that our analysis may not factor in the latest price-sensitive company announcements or qualitative material. Simply Wall St has no position in any stocks mentioned.
About ASX:RMS
Ramelius Resources
Engages in the exploration, evaluation, mine development and operation, production, and sale of gold.
Outstanding track record with flawless balance sheet.
Similar Companies
Market Insights

Advertisement
Community Narratives
MINISO's fair value is projected at 26.69 with an anticipated PE ratio shift of 20x
Fair Value US$24.03|11.0% undervalued
BE
Community Contributor
Procter & Gamble: A Dividend Giant Facing Slowing Growth
Fair Value US$119.81|23.3% overvalued
AN
Community Contributor
Eli Lilly's Future Growth Driven by Tirzepatide and Favorable Market Conditions
Fair Value US$1.19k|13.8% undervalued
EA
Community Contributor