- Australia
- /
- Metals and Mining
- /
- ASX:PRU
Perseus Mining (ASX:PRU) grows 8.8% this week, taking five-year gains to 456%


Buying shares in the best businesses can build meaningful wealth for you and your family. While the best companies are hard to find, but they can generate massive returns over long periods. To wit, the Perseus Mining Limited (ASX:PRU) share price has soared 429% over five years. This just goes to show the value creation that some businesses can achieve. It's also good to see the share price up 46% over the last quarter.
The past week has proven to be lucrative for Perseus Mining investors, so let's see if fundamentals drove the company's five-year performance.
Check out our latest analysis for Perseus Mining
While markets are a powerful pricing mechanism, share prices reflect investor sentiment, not just underlying business performance. One way to examine how market sentiment has changed over time is to look at the interaction between a company's share price and its earnings per share (EPS).
During the last half decade, Perseus Mining became profitable. That kind of transition can be an inflection point that justifies a strong share price gain, just as we have seen here. Since the company was unprofitable five years ago, but not three years ago, it's worth taking a look at the returns in the last three years, too. Indeed, the Perseus Mining share price has gained 79% in three years. In the same period, EPS is up 52% per year. This EPS growth is higher than the 21% average annual increase in the share price over the same three years. So you might conclude the market is a little more cautious about the stock, these days. This cautious sentiment is reflected in its (fairly low) P/E ratio of 7.15.
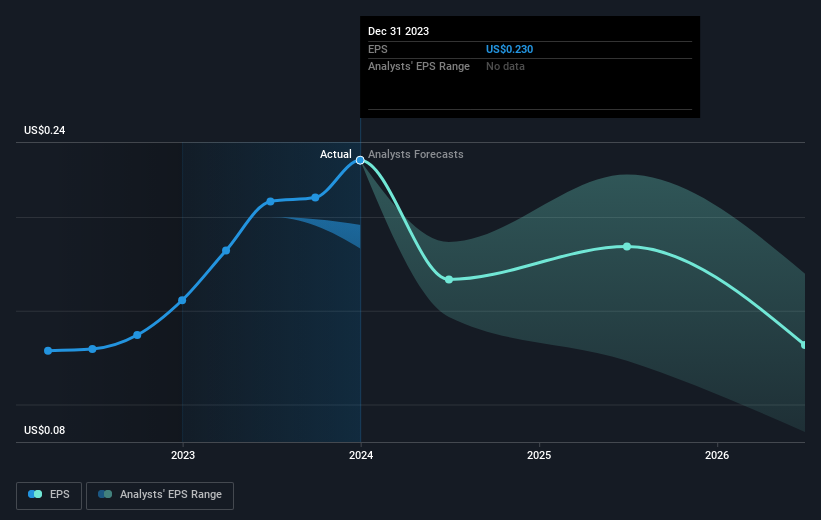
The image below shows how EPS has tracked over time (if you click on the image you can see greater detail).
It is of course excellent to see how Perseus Mining has grown profits over the years, but the future is more important for shareholders. Take a more thorough look at Perseus Mining's financial health with this free report on its balance sheet.
What About Dividends?
As well as measuring the share price return, investors should also consider the total shareholder return (TSR). The TSR is a return calculation that accounts for the value of cash dividends (assuming that any dividend received was reinvested) and the calculated value of any discounted capital raisings and spin-offs. It's fair to say that the TSR gives a more complete picture for stocks that pay a dividend. We note that for Perseus Mining the TSR over the last 5 years was 456%, which is better than the share price return mentioned above. And there's no prize for guessing that the dividend payments largely explain the divergence!
A Different Perspective
It's nice to see that Perseus Mining shareholders have received a total shareholder return of 29% over the last year. And that does include the dividend. However, that falls short of the 41% TSR per annum it has made for shareholders, each year, over five years. I find it very interesting to look at share price over the long term as a proxy for business performance. But to truly gain insight, we need to consider other information, too. Consider risks, for instance. Every company has them, and we've spotted 1 warning sign for Perseus Mining you should know about.
For those who like to find winning investments this free list of undervalued companies with recent insider purchasing, could be just the ticket.
Please note, the market returns quoted in this article reflect the market weighted average returns of stocks that currently trade on Australian exchanges.
New: Manage All Your Stock Portfolios in One Place
We've created the ultimate portfolio companion for stock investors, and it's free.
• Connect an unlimited number of Portfolios and see your total in one currency
• Be alerted to new Warning Signs or Risks via email or mobile
• Track the Fair Value of your stocks
Have feedback on this article? Concerned about the content? Get in touch with us directly. Alternatively, email editorial-team (at) simplywallst.com.
This article by Simply Wall St is general in nature. We provide commentary based on historical data and analyst forecasts only using an unbiased methodology and our articles are not intended to be financial advice. It does not constitute a recommendation to buy or sell any stock, and does not take account of your objectives, or your financial situation. We aim to bring you long-term focused analysis driven by fundamental data. Note that our analysis may not factor in the latest price-sensitive company announcements or qualitative material. Simply Wall St has no position in any stocks mentioned.
About ASX:PRU
Perseus Mining
Explores, evaluates, develops, and mines for gold properties in West Africa.
Flawless balance sheet and undervalued.

