
Advertisement
- Australia
- /
- Metals and Mining
- /
- ASX:MLX
Revenues Working Against Metals X Limited's (ASX:MLX) Share Price Following 27% Dive
Metals X Limited (ASX:MLX) shares have retraced a considerable 27% in the last month, reversing a fair amount of their solid recent performance. Looking back over the past twelve months the stock has been a solid performer regardless, with a gain of 12%.
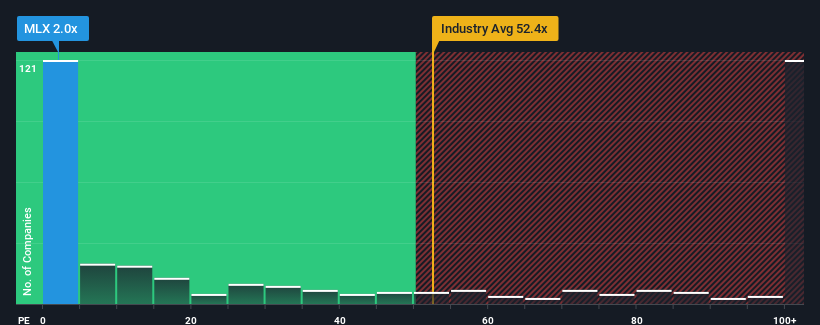
Since its price has dipped substantially, Metals X's price-to-sales (or "P/S") ratio of 2x might make it look like a strong buy right now compared to the wider Metals and Mining industry in Australia, where around half of the companies have P/S ratios above 52.9x and even P/S above 345x are quite common. Although, it's not wise to just take the P/S at face value as there may be an explanation why it's so limited.
We've discovered 1 warning sign about Metals X. View them for free.See our latest analysis for Metals X
What Does Metals X's Recent Performance Look Like?
Metals X certainly has been doing a great job lately as it's been growing its revenue at a really rapid pace. Perhaps the market is expecting future revenue performance to dwindle, which has kept the P/S suppressed. If you like the company, you'd be hoping this isn't the case so that you could potentially pick up some stock while it's out of favour.
Want the full picture on earnings, revenue and cash flow for the company? Then our free report on Metals X will help you shine a light on its historical performance.What Are Revenue Growth Metrics Telling Us About The Low P/S?
Metals X's P/S ratio would be typical for a company that's expected to deliver very poor growth or even falling revenue, and importantly, perform much worse than the industry.
If we review the last year of revenue growth, the company posted a terrific increase of 42%. The strong recent performance means it was also able to grow revenue by 45% in total over the last three years. Therefore, it's fair to say the revenue growth recently has been superb for the company.
Comparing the recent medium-term revenue trends against the industry's one-year growth forecast of 42% shows it's noticeably less attractive.
With this information, we can see why Metals X is trading at a P/S lower than the industry. Apparently many shareholders weren't comfortable holding on to something they believe will continue to trail the wider industry.
The Final Word
Metals X's P/S looks about as weak as its stock price lately. Generally, our preference is to limit the use of the price-to-sales ratio to establishing what the market thinks about the overall health of a company.
In line with expectations, Metals X maintains its low P/S on the weakness of its recent three-year growth being lower than the wider industry forecast. At this stage investors feel the potential for an improvement in revenue isn't great enough to justify a higher P/S ratio. Unless the recent medium-term conditions improve, they will continue to form a barrier for the share price around these levels.
Before you take the next step, you should know about the 1 warning sign for Metals X that we have uncovered.
If you're unsure about the strength of Metals X's business, why not explore our interactive list of stocks with solid business fundamentals for some other companies you may have missed.
New: Manage All Your Stock Portfolios in One Place
We've created the ultimate portfolio companion for stock investors, and it's free.
• Connect an unlimited number of Portfolios and see your total in one currency
• Be alerted to new Warning Signs or Risks via email or mobile
• Track the Fair Value of your stocks
Have feedback on this article? Concerned about the content? Get in touch with us directly. Alternatively, email editorial-team (at) simplywallst.com.
This article by Simply Wall St is general in nature. We provide commentary based on historical data and analyst forecasts only using an unbiased methodology and our articles are not intended to be financial advice. It does not constitute a recommendation to buy or sell any stock, and does not take account of your objectives, or your financial situation. We aim to bring you long-term focused analysis driven by fundamental data. Note that our analysis may not factor in the latest price-sensitive company announcements or qualitative material. Simply Wall St has no position in any stocks mentioned.
About ASX:MLX
Flawless balance sheet with solid track record.
Similar Companies
Market Insights

Advertisement
Community Narratives
MINISO's fair value is projected at 26.69 with an anticipated PE ratio shift of 20x
Fair Value US$24.03|11.4% undervalued
BE
Community Contributor
Procter & Gamble: A Dividend Giant Facing Slowing Growth
Fair Value US$119.81|23.5% overvalued
AN
Community Contributor
Eli Lilly's Future Growth Driven by Tirzepatide and Favorable Market Conditions
Fair Value US$1.19k|14.0% undervalued
EA
Community Contributor