
Advertisement
- Australia
- /
- Metals and Mining
- /
- ASX:MI6
A Look At Minerals 260 (ASX:MI6) Valuation After Bullabulling Gold Resource Upgrade And Pre‑Feasibility Progress
Minerals 260 (ASX:MI6) is attracting fresh attention after reporting a substantial increase in the Bullabulling gold resource to 4.5 million ounces, supported by extensive drilling, strong cash reserves and a pre-feasibility study targeted for 2026.
See our latest analysis for Minerals 260.
The recent resource upgrade comes as Minerals 260’s 90 day share price return sits at 48.33%, while its 3 year total shareholder return of 34.85% points to a mixed but improving momentum picture.
If this kind of emerging gold story has your attention, it could be a good moment to broaden your search and check out fast growing stocks with high insider ownership.
With the share price up 48.33% over 90 days and a price target implying a large theoretical discount, the key question now is whether Minerals 260 still offers upside potential or if the market is already pricing in future growth.
Price to Book of 4.3x: Is It Justified?
Minerals 260 is trading on a P/B of 4.3x, and that sits above the wider Australian Metals and Mining industry average of 2.8x at the last close of A$0.45.
The P/B ratio compares the company’s market value to its book value, which for exploration heavy miners can reflect how the market views the potential of the asset base versus its current accounting value.
For Minerals 260, a higher P/B can suggest investors are already assigning meaningful value to projects like Bullabulling despite the company being unprofitable and reporting a net loss of A$11.52m with minimal current revenue. At the same time, the stock’s P/B of 4.3x is lower than the peer average of 9.1x cited for its comparison group, which highlights a gap between how the market is pricing Minerals 260 versus closer peers, even though it screens as expensive against the broader industry.
Result: Price to book of 4.3x (ABOUT RIGHT)
See what the numbers say about this price — find out in our valuation breakdown.
However, you also need to keep in mind that the company is still loss making, with a net loss of A$11.52m and no current revenue to support its valuation.
Find out about the key risks to this Minerals 260 narrative.
Another Take: What Does The DCF Say?
While the P/B of 4.3x makes Minerals 260 look expensive against the broader industry, our DCF model points in the opposite direction, with the shares trading at a large discount to an estimated future cash flow value of A$2.73. When two methods disagree this much, which signal do you trust more?
Look into how the SWS DCF model arrives at its fair value.
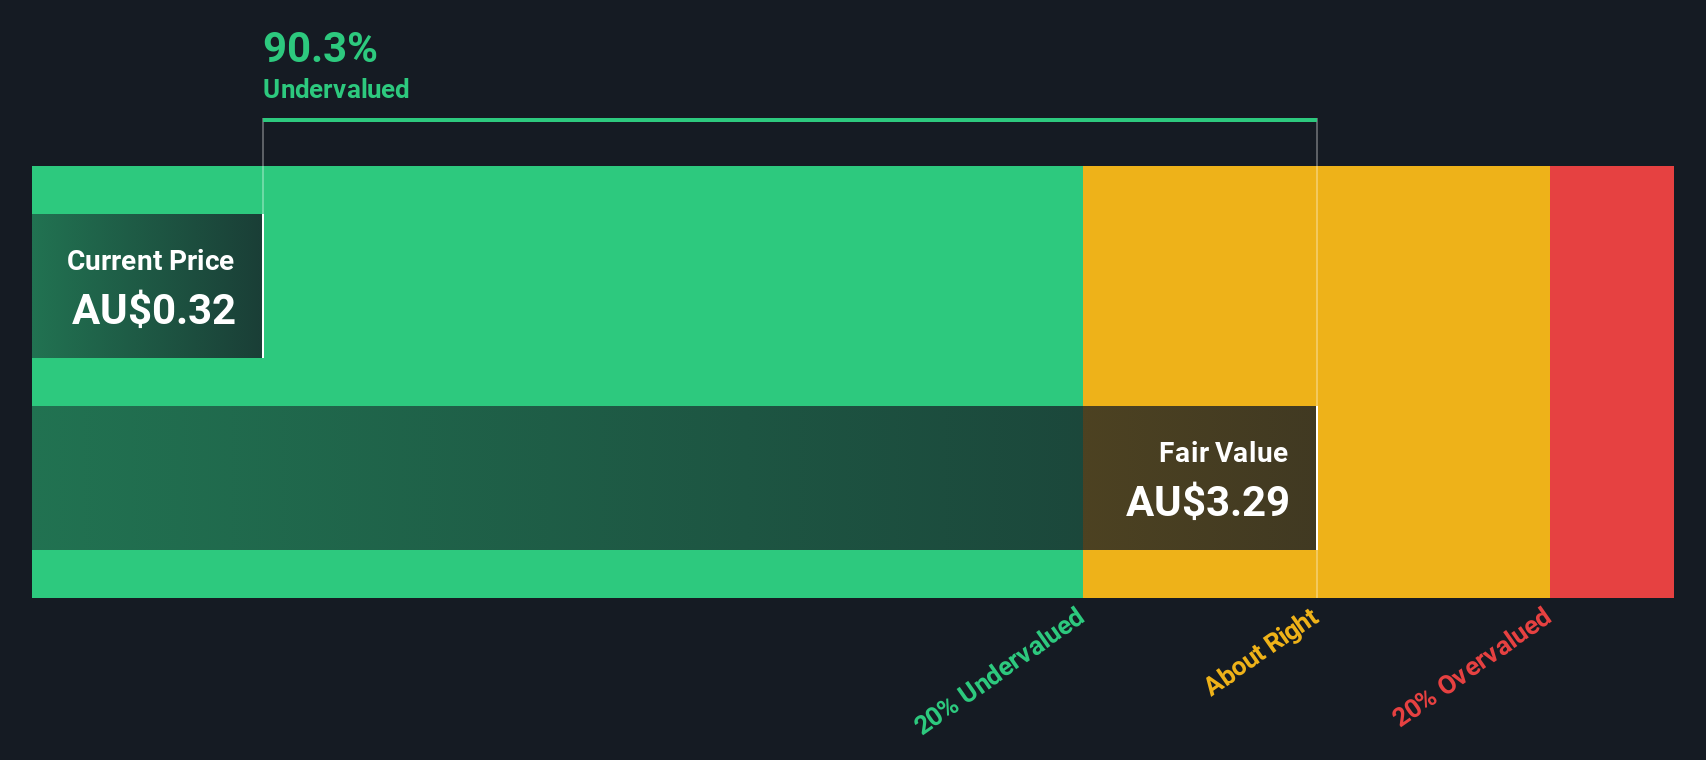
Simply Wall St performs a discounted cash flow (DCF) on every stock in the world every day (check out Minerals 260 for example). We show the entire calculation in full. You can track the result in your watchlist or portfolio and be alerted when this changes, or use our stock screener to discover 875 undervalued stocks based on their cash flows. If you save a screener we even alert you when new companies match - so you never miss a potential opportunity.
Build Your Own Minerals 260 Narrative
If you see the numbers differently or prefer to lean on your own work, you can stress test the assumptions, shape your thesis and get started in just a few minutes: Do it your way.
A great starting point for your Minerals 260 research is our analysis highlighting 2 key rewards and 2 important warning signs that could impact your investment decision.
Looking for more investment ideas?
If Minerals 260 has sparked your interest, do not stop here. Widen your watchlist with a few focused stock groups that could surface new opportunities for you.
- Spot potential value plays by checking out these 875 undervalued stocks based on cash flows that line up current prices with underlying cash flow strength.
- Ride the growth of next gen technologies by scanning these 24 AI penny stocks that are building real businesses around artificial intelligence.
- Strengthen your income focus by reviewing these 12 dividend stocks with yields > 3% that could support a more reliable stream of cash returns.
This article by Simply Wall St is general in nature. We provide commentary based on historical data and analyst forecasts only using an unbiased methodology and our articles are not intended to be financial advice. It does not constitute a recommendation to buy or sell any stock, and does not take account of your objectives, or your financial situation. We aim to bring you long-term focused analysis driven by fundamental data. Note that our analysis may not factor in the latest price-sensitive company announcements or qualitative material. Simply Wall St has no position in any stocks mentioned.
New: Manage All Your Stock Portfolios in One Place
We've created the ultimate portfolio companion for stock investors, and it's free.
• Connect an unlimited number of Portfolios and see your total in one currency
• Be alerted to new Warning Signs or Risks via email or mobile
• Track the Fair Value of your stocks
Have feedback on this article? Concerned about the content? Get in touch with us directly. Alternatively, email editorial-team@simplywallst.com
MI

The Foxhole
Gold miners still look inexpensive because the market thinks we're near the top of the cycle. Given what's happening to the dollar, I'm not so sure.
1110
ST
steve_investor
Is it a safer bet on gold to have just exposure to ETFs?
MA
marcus_l38oa
Between 2003 and 2011, gold nearly went 5x. Dollar went weak too. The gold companies did bad. It is worth noting that between 2003 and 2011, there was 2008! I will leave it your inference and research.
About ASX:MI6
Minerals 260
Engages in the exploration and evaluation of mineral resources in Australia.
Excellent balance sheet with moderate growth potential.
Similar Companies
Market Insights


Advertisement
Weekly Picks
RI


Rick_Orford on Starfighters Space ·
The 1960s Fighter Jet That Could Crack Open a $20 Billion Satellite Market
Fair Value:US$520.4% undervalued
58 followersusers have followed this narrative
3 commentsusers have commented on this narrative
7 likesusers have liked this narrative
JO


John_Eric on MercadoLibre ·
MercadoLibre and the Spreadsheet Trick That Decides Everything
Fair Value:US$7.31k73.7% undervalued
105 followersusers have followed this narrative
2 commentsusers have commented on this narrative
16 likesusers have liked this narrative
RC

rcb9 on PayPal Holdings ·
Ten Percent More Volume, One Percent More Transaction Margin
Fair Value:US$70.8912.1% undervalued
15 followersusers have followed this narrative
1 commentusers have commented on this narrative
6 likesusers have liked this narrative
HE


HedgeY on Micron Technology ·
Micron - The Memory Bottleneck Behind the AI Supercycle
Fair Value:US$1.25k22.1% undervalued
41 followersusers have followed this narrative
0 commentsusers have commented on this narrative
13 likesusers have liked this narrative
Recently Updated Narratives
PI


PittTheYounger on Neste Oyj ·
Long-overlooked renewable fuels champion starts to get attention it deserves
Fair Value:€48.6832.5% undervalued
1 followerusers have followed this narrative
0 commentsusers have commented on this narrative
0 likesusers have liked this narrative
LU


LunaRodas on BJ's Wholesale Club Holdings ·
BJ | BJ's Wholesale Club: What They Said vs. What They Did
Fair Value:US$108.2215.6% undervalued
1 followerusers have followed this narrative
0 commentsusers have commented on this narrative
0 likesusers have liked this narrative
DO


Double_Bubbler on Vertical Aerospace ·
Why Vertical Aerospace (NYSE: EVTL) is Worth Possibly Over 13x its Current Price
Fair Value:US$375.0% undervalued
55 followersusers have followed this narrative
4 commentsusers have commented on this narrative
0 likesusers have liked this narrative
Popular Narratives
OS


oscargarcia on NVIDIA ·
The company that went from selling GPUs to gamers to becoming the AI arms dealer of the 21st century.
Fair Value:US$28022.6% undervalued
338 followersusers have followed this narrative
9 commentsusers have commented on this narrative
16 likesusers have liked this narrative
CU

CubanEros on Microsoft ·
A wonderful business at reasonable price.
Fair Value:US$419.9114.6% overvalued
186 followersusers have followed this narrative
0 commentsusers have commented on this narrative
9 likesusers have liked this narrative
KI

KiwiInvest on Amazon.com ·
Amazon's high growth, high tech segments propel its profits, while traditional segments plod along
Fair Value:US$475.0945.3% undervalued
213 followersusers have followed this narrative
1 commentusers have commented on this narrative
8 likesusers have liked this narrative
Trending Discussion

JO
johnk72 on Global X AI Infrastructure ETF ·
Great picks & shovels investment. I hold 3,000 units with a plan to hold until the end of 2028
2
|0
