
Advertisement
Legendary fund manager Li Lu (who Charlie Munger backed) once said, 'The biggest investment risk is not the volatility of prices, but whether you will suffer a permanent loss of capital.' It's only natural to consider a company's balance sheet when you examine how risky it is, since debt is often involved when a business collapses. As with many other companies Firefinch Limited (ASX:FFX) makes use of debt. But the more important question is: how much risk is that debt creating?
Why Does Debt Bring Risk?
Debt assists a business until the business has trouble paying it off, either with new capital or with free cash flow. In the worst case scenario, a company can go bankrupt if it cannot pay its creditors. However, a more usual (but still expensive) situation is where a company must dilute shareholders at a cheap share price simply to get debt under control. Of course, plenty of companies use debt to fund growth, without any negative consequences. The first thing to do when considering how much debt a business uses is to look at its cash and debt together.
Check out our latest analysis for Firefinch
How Much Debt Does Firefinch Carry?
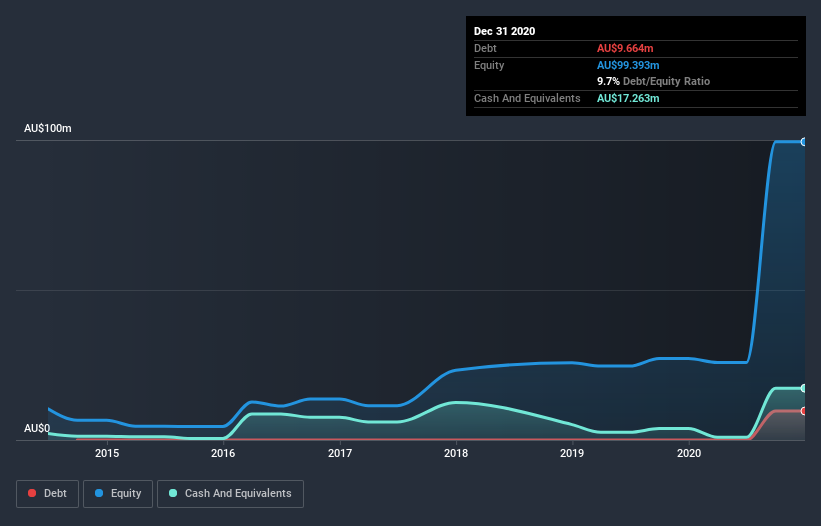
The image below, which you can click on for greater detail, shows that at December 2020 Firefinch had debt of AU$9.60m, up from none in one year. However, it does have AU$17.3m in cash offsetting this, leading to net cash of AU$7.67m.
How Healthy Is Firefinch's Balance Sheet?
According to the last reported balance sheet, Firefinch had liabilities of AU$23.0m due within 12 months, and liabilities of AU$16.8m due beyond 12 months. Offsetting this, it had AU$17.3m in cash and AU$14.0m in receivables that were due within 12 months. So its liabilities outweigh the sum of its cash and (near-term) receivables by AU$8.51m.
Since publicly traded Firefinch shares are worth a total of AU$168.2m, it seems unlikely that this level of liabilities would be a major threat. Having said that, it's clear that we should continue to monitor its balance sheet, lest it change for the worse. While it does have liabilities worth noting, Firefinch also has more cash than debt, so we're pretty confident it can manage its debt safely. The balance sheet is clearly the area to focus on when you are analysing debt. But you can't view debt in total isolation; since Firefinch will need earnings to service that debt. So when considering debt, it's definitely worth looking at the earnings trend. Click here for an interactive snapshot.
While it hasn't made a profit, at least Firefinch booked its first revenue as a publicly listed company, in the last twelve months.
So How Risky Is Firefinch?
Although Firefinch had an earnings before interest and tax (EBIT) loss over the last twelve months, it made a statutory profit of AU$114k. So when you consider it has net cash, along with the statutory profit, the stock probably isn't as risky as it might seem, at least in the short term. Until we see some positive EBIT, we're a bit cautious of the stock, not least because of the rather modest revenue growth. When analysing debt levels, the balance sheet is the obvious place to start. However, not all investment risk resides within the balance sheet - far from it. For example, we've discovered 2 warning signs for Firefinch (1 is a bit unpleasant!) that you should be aware of before investing here.
When all is said and done, sometimes its easier to focus on companies that don't even need debt. Readers can access a list of growth stocks with zero net debt 100% free, right now.
If you’re looking to trade Firefinch, open an account with the lowest-cost* platform trusted by professionals, Interactive Brokers. Their clients from over 200 countries and territories trade stocks, options, futures, forex, bonds and funds worldwide from a single integrated account. Promoted
New: AI Stock Screener & Alerts
Our new AI Stock Screener scans the market every day to uncover opportunities.
• Dividend Powerhouses (3%+ Yield)
• Undervalued Small Caps with Insider Buying
• High growth Tech and AI Companies
Or build your own from over 50 metrics.
This article by Simply Wall St is general in nature. It does not constitute a recommendation to buy or sell any stock, and does not take account of your objectives, or your financial situation. We aim to bring you long-term focused analysis driven by fundamental data. Note that our analysis may not factor in the latest price-sensitive company announcements or qualitative material. Simply Wall St has no position in any stocks mentioned.
*Interactive Brokers Rated Lowest Cost Broker by StockBrokers.com Annual Online Review 2020
Have feedback on this article? Concerned about the content? Get in touch with us directly. Alternatively, email editorial-team (at) simplywallst.com.
About ASX:FFX
Excellent balance sheet and slightly overvalued.
Market Insights

Advertisement
Community Narratives
MINISO's fair value is projected at 26.69 with an anticipated PE ratio shift of 20x
Fair Value US$24.03|9.0% undervalued
BE
Community Contributor
Procter & Gamble: A Dividend Giant Facing Slowing Growth
Fair Value US$119.81|23.5% overvalued
AN
Community Contributor
Eli Lilly's Future Growth Driven by Tirzepatide and Favorable Market Conditions
Fair Value US$1.19k|14.4% undervalued
EA
Community Contributor