Advertisement
- Australia
- /
- Metals and Mining
- /
- ASX:CMM
Capricorn Metals (ASX:CMM): Assessing Valuation After Reserve Growth and Continued Exploration Success

Simply Wall St
Reviewed by Kshitija Bhandaru
Capricorn Metals (ASX:CMM) released its group Ore Reserve update, maintaining reserves at 4 million ounces as of June 30, 2025. New additions at Highway, Aries, and Comanche satellite pits highlight continued growth through exploration and drilling activity.
See our latest analysis for Capricorn Metals.
Capricorn Metals has enjoyed a remarkable run, with the latest 30-day share price return of 16.3%. This has helped drive an impressive 123% total shareholder return over the past year. Momentum is clearly building as investors respond positively to the company’s sustained reserve growth and ongoing exploration success.
If you’re looking for more opportunities with companies showing strong growth and high insider ownership, now is a great time to discover fast growing stocks with high insider ownership
With so much momentum and fresh exploration success, the big question is whether Capricorn Metals is undervalued at current levels or if the market has already priced in this growth. This consideration raises the possibility that there may be little room for further upside.
Price-to-Earnings of 37.9x: Is it justified?
Capricorn Metals is trading on a price-to-earnings (P/E) ratio of 37.9x, placing its valuation well above the Australian Metals and Mining industry average of 21.8x. At a last close price of A$13.19, investors are paying a substantial premium for the company’s future earnings.
The P/E ratio measures how much investors are willing to pay per dollar of earnings. This metric serves as a key yardstick for companies with strong profitability and growth prospects. Higher growth can justify a higher P/E, especially in resource sectors where reserves expansion and profit trajectory are important factors.
While Capricorn is growing faster than its peers and has a strong recent track record, the current multiple remains expensive compared to the sector. The fair price-to-earnings ratio here is 25.4x, a level that reflects a more balanced view of sustainable future earnings for a company like Capricorn Metals. If the market sentiment changes, the valuation could shift towards this fair ratio.
Explore the SWS fair ratio for Capricorn Metals
Result: Price-to-Earnings of 37.9x (OVERVALUED)
However, risks remain if gold prices retreat or if operational disruptions emerge, which could quickly temper investor enthusiasm and drag on performance.
Find out about the key risks to this Capricorn Metals narrative.
Another View: Is Capricorn Actually Undervalued?
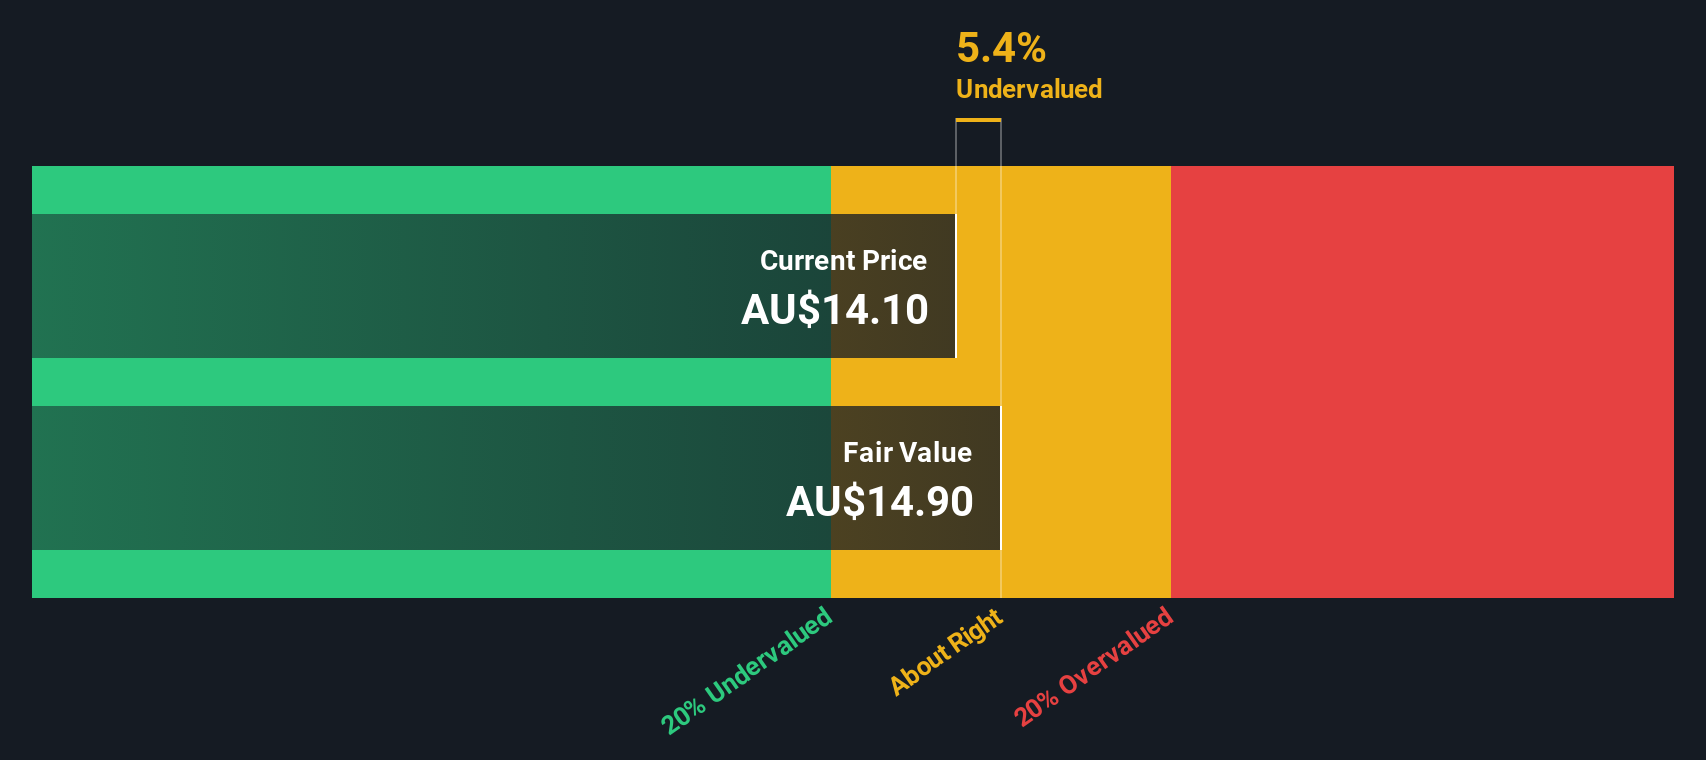
Looking at Capricorn Metals through the lens of our DCF model, the picture shifts. While the P/E ratio suggests the stock is expensive, the SWS DCF model estimates fair value at A$14.91, about 11.5% above the current price. This implies Capricorn might actually be undervalued by the market. Could this gap reveal a hidden opportunity?
Look into how the SWS DCF model arrives at its fair value.
Simply Wall St performs a discounted cash flow (DCF) on every stock in the world every day (check out Capricorn Metals for example). We show the entire calculation in full. You can track the result in your watchlist or portfolio and be alerted when this changes, or use our stock screener to discover undervalued stocks based on their cash flows. If you save a screener we even alert you when new companies match - so you never miss a potential opportunity.
Build Your Own Capricorn Metals Narrative
If you have your own perspective or prefer personally investigating the numbers, you can quickly develop your own analysis and insights. In just a few minutes, Do it your way
A good starting point is our analysis highlighting 3 key rewards investors are optimistic about regarding Capricorn Metals.
Looking for More Smart Investment Ideas?
Opportunities abound for investors who look beyond the obvious. Use the Simply Wall Street Screener to move ahead, discover promising sectors, and give your portfolio an edge.
- Tap into fast-growing markets by targeting these 24 AI penny stocks, which are at the forefront of artificial intelligence innovation.
- Unlock future income potential by pursuing these 19 dividend stocks with yields > 3%, offering steady yields above 3% and solid financial footing.
- Strengthen your diversification by adding exposure to digital assets with these 79 cryptocurrency and blockchain stocks, shaping tomorrow’s blockchain landscape.
This article by Simply Wall St is general in nature. We provide commentary based on historical data and analyst forecasts only using an unbiased methodology and our articles are not intended to be financial advice. It does not constitute a recommendation to buy or sell any stock, and does not take account of your objectives, or your financial situation. We aim to bring you long-term focused analysis driven by fundamental data. Note that our analysis may not factor in the latest price-sensitive company announcements or qualitative material. Simply Wall St has no position in any stocks mentioned.
New: AI Stock Screener & Alerts
Our new AI Stock Screener scans the market every day to uncover opportunities.
• Dividend Powerhouses (3%+ Yield)
• Undervalued Small Caps with Insider Buying
• High growth Tech and AI Companies
Or build your own from over 50 metrics.
Have feedback on this article? Concerned about the content? Get in touch with us directly. Alternatively, email editorial-team@simplywallst.com
About ASX:CMM
Capricorn Metals
Explores, develops, evaluates, and produces gold in Australia.
Exceptional growth potential with flawless balance sheet.
Similar Companies
Market Insights

Advertisement
Community Narratives
MicroVision will explode future revenue by 380.37% with a vision towards success
Fair Value US$60|98.4% undervalued
TH
Community Contributor
The Indispensable Artery for a New North American Economy
Fair Value CA$132.87|0.6% undervalued
TI
Community Contributor
Recently Updated Narratives
BE


Bejgal on MINISO Group Holding ·
MINISO's fair value is projected at 26.69 with an anticipated PE ratio shift of 20x
Fair Value:US$26.6926.7% undervalued
44 followersusers have followed this narrative
3 commentsusers have commented on this narrative
0 likesusers have liked this narrative
TI


TickerTickle on Oracle ·
The Quiet Giant That Became AI’s Power Grid
Fair Value:US$389.8147.4% undervalued
8 followersusers have followed this narrative
1 commentusers have commented on this narrative
0 likesusers have liked this narrative
AU

AuCA on Nova Ljubljanska Banka d.d ·
Nova Ljubljanska Banka d.d will expect a 11.2% revenue boost driving future growth
Fair Value:€20916.5% undervalued
23 followersusers have followed this narrative
3 commentsusers have commented on this narrative
0 likesusers have liked this narrative
Popular Narratives
OS


oscargarcia on Alphabet ·
The company that turned a verb into a global necessity and basically runs the modern internet, digital ads, smartphones, maps, and AI.
Fair Value:US$3405.9% undervalued
136 followersusers have followed this narrative
6 commentsusers have commented on this narrative
18 likesusers have liked this narrative
TH

TheWallstreetKing on MicroVision ·
MicroVision will explode future revenue by 380.37% with a vision towards success
Fair Value:US$6098.4% undervalued
88 followersusers have followed this narrative
11 commentsusers have commented on this narrative
18 likesusers have liked this narrative
AN


AnalystConsensusTarget on NVIDIA ·
NVDA: Expanding AI Demand Will Drive Major Data Center Investments Through 2026
Fair Value:US$232.7922.6% undervalued
926 followersusers have followed this narrative
6 commentsusers have commented on this narrative
22 likesusers have liked this narrative