
Advertisement
Key Insights
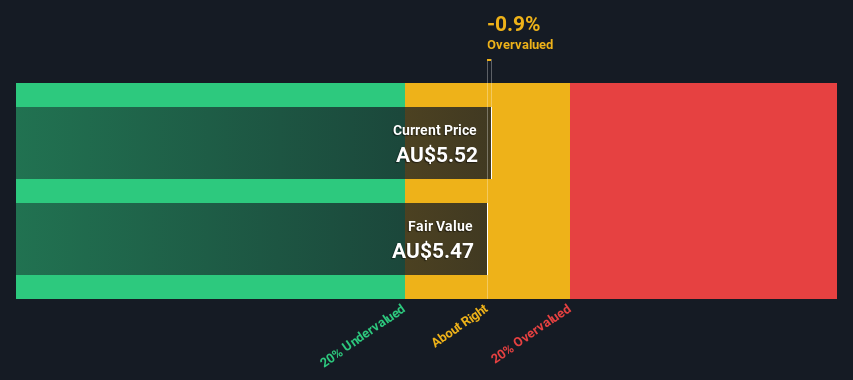
- The projected fair value for Boral is AU$5.47 based on 2 Stage Free Cash Flow to Equity
- Current share price of AU$5.52 suggests Boral is potentially trading close to its fair value
- Our fair value estimate is 14% higher than Boral's analyst price target of AU$4.78
Today we'll do a simple run through of a valuation method used to estimate the attractiveness of Boral Limited (ASX:BLD) as an investment opportunity by projecting its future cash flows and then discounting them to today's value. Our analysis will employ the Discounted Cash Flow (DCF) model. Models like these may appear beyond the comprehension of a lay person, but they're fairly easy to follow.
Remember though, that there are many ways to estimate a company's value, and a DCF is just one method. For those who are keen learners of equity analysis, the Simply Wall St analysis model here may be something of interest to you.
See our latest analysis for Boral
Step By Step Through The Calculation
We are going to use a two-stage DCF model, which, as the name states, takes into account two stages of growth. The first stage is generally a higher growth period which levels off heading towards the terminal value, captured in the second 'steady growth' period. To start off with, we need to estimate the next ten years of cash flows. Where possible we use analyst estimates, but when these aren't available we extrapolate the previous free cash flow (FCF) from the last estimate or reported value. We assume companies with shrinking free cash flow will slow their rate of shrinkage, and that companies with growing free cash flow will see their growth rate slow, over this period. We do this to reflect that growth tends to slow more in the early years than it does in later years.
Generally we assume that a dollar today is more valuable than a dollar in the future, and so the sum of these future cash flows is then discounted to today's value:
10-year free cash flow (FCF) forecast
| 2024 | 2025 | 2026 | 2027 | 2028 | 2029 | 2030 | 2031 | 2032 | 2033 | |
| Levered FCF (A$, Millions) | AU$231.7m | AU$254.3m | AU$269.9m | AU$284.8m | AU$320.9m | AU$340.0m | AU$356.2m | AU$370.4m | AU$383.0m | AU$394.5m |
| Growth Rate Estimate Source | Analyst x5 | Analyst x5 | Analyst x5 | Analyst x2 | Analyst x2 | Est @ 5.94% | Est @ 4.78% | Est @ 3.97% | Est @ 3.40% | Est @ 3.01% |
| Present Value (A$, Millions) Discounted @ 7.2% | AU$216 | AU$221 | AU$219 | AU$215 | AU$226 | AU$224 | AU$218 | AU$212 | AU$204 | AU$196 |
("Est" = FCF growth rate estimated by Simply Wall St)
Present Value of 10-year Cash Flow (PVCF) = AU$2.2b
The second stage is also known as Terminal Value, this is the business's cash flow after the first stage. For a number of reasons a very conservative growth rate is used that cannot exceed that of a country's GDP growth. In this case we have used the 5-year average of the 10-year government bond yield (2.1%) to estimate future growth. In the same way as with the 10-year 'growth' period, we discount future cash flows to today's value, using a cost of equity of 7.2%.
Terminal Value (TV)= FCF2033 × (1 + g) ÷ (r – g) = AU$395m× (1 + 2.1%) ÷ (7.2%– 2.1%) = AU$7.8b
Present Value of Terminal Value (PVTV)= TV / (1 + r)10= AU$7.8b÷ ( 1 + 7.2%)10= AU$3.9b
The total value is the sum of cash flows for the next ten years plus the discounted terminal value, which results in the Total Equity Value, which in this case is AU$6.0b. To get the intrinsic value per share, we divide this by the total number of shares outstanding. Compared to the current share price of AU$5.5, the company appears around fair value at the time of writing. The assumptions in any calculation have a big impact on the valuation, so it is better to view this as a rough estimate, not precise down to the last cent.
Important Assumptions
We would point out that the most important inputs to a discounted cash flow are the discount rate and of course the actual cash flows. Part of investing is coming up with your own evaluation of a company's future performance, so try the calculation yourself and check your own assumptions. The DCF also does not consider the possible cyclicality of an industry, or a company's future capital requirements, so it does not give a full picture of a company's potential performance. Given that we are looking at Boral as potential shareholders, the cost of equity is used as the discount rate, rather than the cost of capital (or weighted average cost of capital, WACC) which accounts for debt. In this calculation we've used 7.2%, which is based on a levered beta of 1.032. Beta is a measure of a stock's volatility, compared to the market as a whole. We get our beta from the industry average beta of globally comparable companies, with an imposed limit between 0.8 and 2.0, which is a reasonable range for a stable business.
SWOT Analysis for Boral
Strength
- Debt is not viewed as a risk.
Weakness
- Expensive based on P/E ratio and estimated fair value.
Opportunity
- Annual earnings are forecast to grow faster than the Australian market.
Threat
- Annual revenue is forecast to grow slower than the Australian market.
Looking Ahead:
Valuation is only one side of the coin in terms of building your investment thesis, and it shouldn't be the only metric you look at when researching a company. DCF models are not the be-all and end-all of investment valuation. Rather it should be seen as a guide to "what assumptions need to be true for this stock to be under/overvalued?" For example, changes in the company's cost of equity or the risk free rate can significantly impact the valuation. For Boral, we've compiled three further factors you should consider:
- Financial Health: Does BLD have a healthy balance sheet? Take a look at our free balance sheet analysis with six simple checks on key factors like leverage and risk.
- Future Earnings: How does BLD's growth rate compare to its peers and the wider market? Dig deeper into the analyst consensus number for the upcoming years by interacting with our free analyst growth expectation chart.
- Other High Quality Alternatives: Do you like a good all-rounder? Explore our interactive list of high quality stocks to get an idea of what else is out there you may be missing!
PS. The Simply Wall St app conducts a discounted cash flow valuation for every stock on the ASX every day. If you want to find the calculation for other stocks just search here.
Valuation is complex, but we're here to simplify it.
Discover if Boral might be undervalued or overvalued with our detailed analysis, featuring fair value estimates, potential risks, dividends, insider trades, and its financial condition.
Access Free AnalysisHave feedback on this article? Concerned about the content? Get in touch with us directly. Alternatively, email editorial-team (at) simplywallst.com.
This article by Simply Wall St is general in nature. We provide commentary based on historical data and analyst forecasts only using an unbiased methodology and our articles are not intended to be financial advice. It does not constitute a recommendation to buy or sell any stock, and does not take account of your objectives, or your financial situation. We aim to bring you long-term focused analysis driven by fundamental data. Note that our analysis may not factor in the latest price-sensitive company announcements or qualitative material. Simply Wall St has no position in any stocks mentioned.
About ASX:BLD
Boral
Operates as a vertically integrated construction materials company in Australia.
Flawless balance sheet with proven track record.
Similar Companies
Market Insights

Advertisement
Community Narratives
MINISO's fair value is projected at 26.69 with an anticipated PE ratio shift of 20x
Fair Value US$24.03|11.0% undervalued
BE
Community Contributor
Procter & Gamble: A Dividend Giant Facing Slowing Growth
Fair Value US$119.81|23.3% overvalued
AN
Community Contributor
Eli Lilly's Future Growth Driven by Tirzepatide and Favorable Market Conditions
Fair Value US$1.19k|13.8% undervalued
EA
Community Contributor