- Australia
- /
- Metals and Mining
- /
- ASX:BCN
Beacon Minerals Limited's (ASX:BCN) Stock's On An Uptrend: Are Strong Financials Guiding The Market?


Beacon Minerals' (ASX:BCN) stock is up by a considerable 17% over the past week. Given the company's impressive performance, we decided to study its financial indicators more closely as a company's financial health over the long-term usually dictates market outcomes. Specifically, we decided to study Beacon Minerals' ROE in this article.
Return on equity or ROE is a key measure used to assess how efficiently a company's management is utilizing the company's capital. In simpler terms, it measures the profitability of a company in relation to shareholder's equity.
See our latest analysis for Beacon Minerals
How To Calculate Return On Equity?
ROE can be calculated by using the formula:
Return on Equity = Net Profit (from continuing operations) ÷ Shareholders' Equity
So, based on the above formula, the ROE for Beacon Minerals is:
18% = AU$12m ÷ AU$70m (Based on the trailing twelve months to December 2023).
The 'return' is the yearly profit. So, this means that for every A$1 of its shareholder's investments, the company generates a profit of A$0.18.
What Has ROE Got To Do With Earnings Growth?
So far, we've learned that ROE is a measure of a company's profitability. Depending on how much of these profits the company reinvests or "retains", and how effectively it does so, we are then able to assess a company’s earnings growth potential. Assuming all else is equal, companies that have both a higher return on equity and higher profit retention are usually the ones that have a higher growth rate when compared to companies that don't have the same features.
A Side By Side comparison of Beacon Minerals' Earnings Growth And 18% ROE
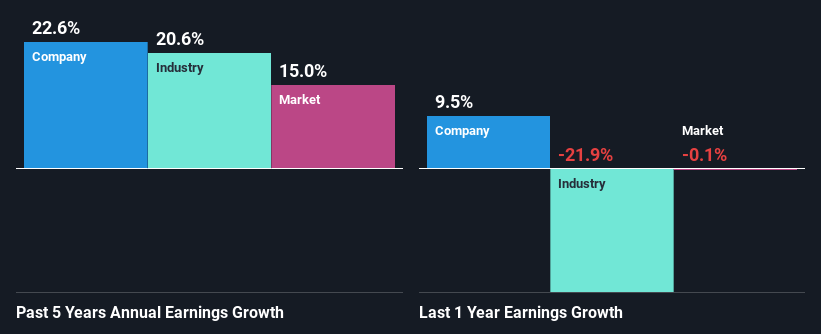
To start with, Beacon Minerals' ROE looks acceptable. Especially when compared to the industry average of 10% the company's ROE looks pretty impressive. This certainly adds some context to Beacon Minerals' exceptional 23% net income growth seen over the past five years. However, there could also be other causes behind this growth. Such as - high earnings retention or an efficient management in place.
As a next step, we compared Beacon Minerals' net income growth with the industry and found that the company has a similar growth figure when compared with the industry average growth rate of 21% in the same period.
Earnings growth is a huge factor in stock valuation. The investor should try to establish if the expected growth or decline in earnings, whichever the case may be, is priced in. This then helps them determine if the stock is placed for a bright or bleak future. What is BCN worth today? The intrinsic value infographic in our free research report helps visualize whether BCN is currently mispriced by the market.
Is Beacon Minerals Making Efficient Use Of Its Profits?
The high three-year median payout ratio of 55% (implying that it keeps only 45% of profits) for Beacon Minerals suggests that the company's growth wasn't really hampered despite it returning most of the earnings to its shareholders.
Additionally, Beacon Minerals has paid dividends over a period of three years which means that the company is pretty serious about sharing its profits with shareholders.
Summary
On the whole, we feel that Beacon Minerals' performance has been quite good. In particular, its high ROE is quite noteworthy and also the probable explanation behind its considerable earnings growth. Yet, the company is retaining a small portion of its profits. Which means that the company has been able to grow its earnings in spite of it, so that's not too bad. Until now, we have only just grazed the surface of the company's past performance by looking at the company's fundamentals. To gain further insights into Beacon Minerals' past profit growth, check out this visualization of past earnings, revenue and cash flows.
Valuation is complex, but we're here to simplify it.
Discover if Beacon Minerals might be undervalued or overvalued with our detailed analysis, featuring fair value estimates, potential risks, dividends, insider trades, and its financial condition.
Access Free AnalysisHave feedback on this article? Concerned about the content? Get in touch with us directly. Alternatively, email editorial-team (at) simplywallst.com.
This article by Simply Wall St is general in nature. We provide commentary based on historical data and analyst forecasts only using an unbiased methodology and our articles are not intended to be financial advice. It does not constitute a recommendation to buy or sell any stock, and does not take account of your objectives, or your financial situation. We aim to bring you long-term focused analysis driven by fundamental data. Note that our analysis may not factor in the latest price-sensitive company announcements or qualitative material. Simply Wall St has no position in any stocks mentioned.
About ASX:BCN
Beacon Minerals
Engages in the mineral exploration, development, and production activities in Western Australia.
Solid track record with excellent balance sheet and pays a dividend.
Similar Companies
Market Insights

Community Narratives


