
David Iben put it well when he said, 'Volatility is not a risk we care about. What we care about is avoiding the permanent loss of capital.' When we think about how risky a company is, we always like to look at its use of debt, since debt overload can lead to ruin. As with many other companies Admiralty Resources NL (ASX:ADY) makes use of debt. But the more important question is: how much risk is that debt creating?
When Is Debt A Problem?
Debt assists a business until the business has trouble paying it off, either with new capital or with free cash flow. Ultimately, if the company can't fulfill its legal obligations to repay debt, shareholders could walk away with nothing. However, a more frequent (but still costly) occurrence is where a company must issue shares at bargain-basement prices, permanently diluting shareholders, just to shore up its balance sheet. Having said that, the most common situation is where a company manages its debt reasonably well - and to its own advantage. The first thing to do when considering how much debt a business uses is to look at its cash and debt together.
See our latest analysis for Admiralty Resources
What Is Admiralty Resources's Net Debt?
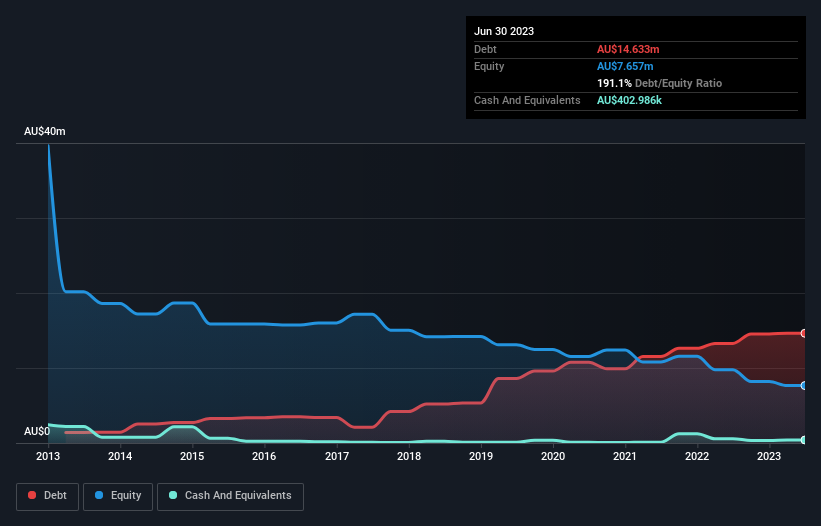
The image below, which you can click on for greater detail, shows that at June 2023 Admiralty Resources had debt of AU$14.6m, up from AU$13.3m in one year. However, because it has a cash reserve of AU$403.0k, its net debt is less, at about AU$14.2m.
How Healthy Is Admiralty Resources' Balance Sheet?
We can see from the most recent balance sheet that Admiralty Resources had liabilities of AU$5.38m falling due within a year, and liabilities of AU$12.6m due beyond that. On the other hand, it had cash of AU$403.0k and AU$72.0k worth of receivables due within a year. So it has liabilities totalling AU$17.5m more than its cash and near-term receivables, combined.
This deficit casts a shadow over the AU$7.82m company, like a colossus towering over mere mortals. So we definitely think shareholders need to watch this one closely. After all, Admiralty Resources would likely require a major re-capitalisation if it had to pay its creditors today. There's no doubt that we learn most about debt from the balance sheet. But you can't view debt in total isolation; since Admiralty Resources will need earnings to service that debt. So if you're keen to discover more about its earnings, it might be worth checking out this graph of its long term earnings trend.
Given its lack of meaningful operating revenue, investors are probably hoping that Admiralty Resources finds some valuable resources, before it runs out of money.
Caveat Emptor
Importantly, Admiralty Resources had an earnings before interest and tax (EBIT) loss over the last year. Its EBIT loss was a whopping AU$1.2m. When we look at that alongside the significant liabilities, we're not particularly confident about the company. We'd want to see some strong near-term improvements before getting too interested in the stock. Not least because it had negative free cash flow of AU$3.3m over the last twelve months. That means it's on the risky side of things. When analysing debt levels, the balance sheet is the obvious place to start. But ultimately, every company can contain risks that exist outside of the balance sheet. These risks can be hard to spot. Every company has them, and we've spotted 4 warning signs for Admiralty Resources you should know about.
If you're interested in investing in businesses that can grow profits without the burden of debt, then check out this free list of growing businesses that have net cash on the balance sheet.
Mobile Infrastructure for Defense and Disaster
The next wave in robotics isn't humanoid. Its fully autonomous towers delivering 5G, ISR, and radar in under 30 minutes, anywhere.
Get the investor briefing before the next round of contracts
Sponsored On Behalf of CiTechNew: Manage All Your Stock Portfolios in One Place
We've created the ultimate portfolio companion for stock investors, and it's free.
• Connect an unlimited number of Portfolios and see your total in one currency
• Be alerted to new Warning Signs or Risks via email or mobile
• Track the Fair Value of your stocks
Have feedback on this article? Concerned about the content? Get in touch with us directly. Alternatively, email editorial-team (at) simplywallst.com.
This article by Simply Wall St is general in nature. We provide commentary based on historical data and analyst forecasts only using an unbiased methodology and our articles are not intended to be financial advice. It does not constitute a recommendation to buy or sell any stock, and does not take account of your objectives, or your financial situation. We aim to bring you long-term focused analysis driven by fundamental data. Note that our analysis may not factor in the latest price-sensitive company announcements or qualitative material. Simply Wall St has no position in any stocks mentioned.
About ASX:ADY
Admiralty Resources
Engages in the mineral exploration business in Australia and Chile.
Medium-low risk and good value.
Market Insights

Weekly Picks

Early mover in a fast growing industry. Likely to experience share price volatility as they scale


A case for CA$31.80 (undiluted), aka 8,616% upside from CA$0.37 (an 86 bagger!).


Moderation and Stabilisation: HOLD: Fair Price based on a 4-year Cycle is $12.08
Recently Updated Narratives


Title: Market Sentiment Is Dead Wrong — Here's Why PSEC Deserves a Second Look


An amazing opportunity to potentially get a 100 bagger

Amazon: Why the World’s Biggest Platform Still Runs on Invisible Economics
Popular Narratives


MicroVision will explode future revenue by 380.37% with a vision towards success


Crazy Undervalued 42 Baggers Silver Play (Active & Running Mine)


NVDA: Expanding AI Demand Will Drive Major Data Center Investments Through 2026
Trending Discussion
