
Advertisement
- Australia
- /
- Basic Materials
- /
- ASX:ABC
What Does Adelaide Brighton Limited's (ASX:ABC) P/E Ratio Tell You?
This article is written for those who want to get better at using price to earnings ratios (P/E ratios). We'll look at Adelaide Brighton Limited's (ASX:ABC) P/E ratio and reflect on what it tells us about the company's share price. Looking at earnings over the last twelve months, Adelaide Brighton has a P/E ratio of 15.31. That is equivalent to an earnings yield of about 6.5%.
View our latest analysis for Adelaide Brighton
How Do I Calculate A Price To Earnings Ratio?
The formula for P/E is:
Price to Earnings Ratio = Price per Share ÷ Earnings per Share (EPS)
Or for Adelaide Brighton:
P/E of 15.31 = A$4.36 ÷ A$0.28 (Based on the year to December 2018.)
Is A High Price-to-Earnings Ratio Good?
The higher the P/E ratio, the higher the price tag of a business, relative to its trailing earnings. That is not a good or a bad thing per se, but a high P/E does imply buyers are optimistic about the future.
How Growth Rates Impact P/E Ratios
When earnings fall, the 'E' decreases, over time. That means unless the share price falls, the P/E will increase in a few years. A higher P/E should indicate the stock is expensive relative to others -- and that may encourage shareholders to sell.
Adelaide Brighton maintained roughly steady earnings over the last twelve months. But EPS is up 3.8% over the last 5 years. And it has shrunk its earnings per share by 3.9% per year over the last three years. This growth rate might warrant a low P/E ratio. So you wouldn't expect a very high P/E.
How Does Adelaide Brighton's P/E Ratio Compare To Its Peers?
The P/E ratio indicates whether the market has higher or lower expectations of a company. The image below shows that Adelaide Brighton has a P/E ratio that is roughly in line with the basic materials industry average (15.2).
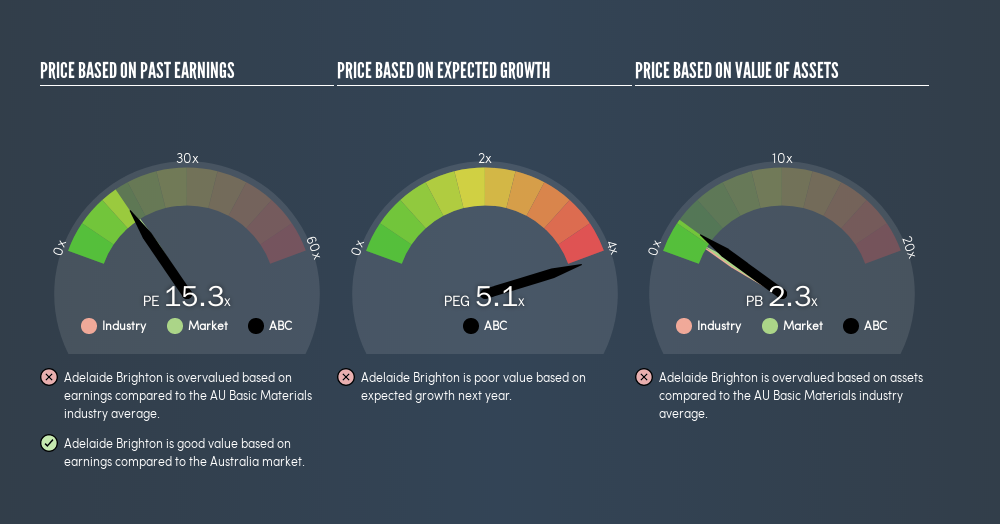
Its P/E ratio suggests that Adelaide Brighton shareholders think that in the future it will perform about the same as other companies in its industry classification. So if Adelaide Brighton actually outperforms its peers going forward, that should be a positive for the share price. Checking factors such as the tenure of the board and management could help you form your own view on if that will happen.
Remember: P/E Ratios Don't Consider The Balance Sheet
One drawback of using a P/E ratio is that it considers market capitalization, but not the balance sheet. In other words, it does not consider any debt or cash that the company may have on the balance sheet. In theory, a company can lower its future P/E ratio by using cash or debt to invest in growth.
While growth expenditure doesn't always pay off, the point is that it is a good option to have; but one that the P/E ratio ignores.
Adelaide Brighton's Balance Sheet
Adelaide Brighton's net debt is 15% of its market cap. That's enough debt to impact the P/E ratio a little; so keep it in mind if you're comparing it to companies without debt.
The Verdict On Adelaide Brighton's P/E Ratio
Adelaide Brighton's P/E is 15.3 which is about average (16.2) in the AU market. With modest debt and some recent earnings growth, it seems likely the market expects a steady performance going forward.
Investors should be looking to buy stocks that the market is wrong about. If the reality for a company is not as bad as the P/E ratio indicates, then the share price should increase as the market realizes this. So this freereport on the analyst consensus forecasts could help you make a master move on this stock.
But note: Adelaide Brighton may not be the best stock to buy. So take a peek at this freelist of interesting companies with strong recent earnings growth (and a P/E ratio below 20).
We aim to bring you long-term focused research analysis driven by fundamental data. Note that our analysis may not factor in the latest price-sensitive company announcements or qualitative material.
If you spot an error that warrants correction, please contact the editor at editorial-team@simplywallst.com. This article by Simply Wall St is general in nature. It does not constitute a recommendation to buy or sell any stock, and does not take account of your objectives, or your financial situation. Simply Wall St has no position in the stocks mentioned. Thank you for reading.
About ASX:ABC
Mediocre balance sheet and overvalued.
Similar Companies
Market Insights

Advertisement
Community Narratives
MicroStrategy: Volatile Gamble or Golden Opportunity?
Fair Value US$663.00|36.2% undervalued
BL
Community Contributor
Emerging Markets and Debt Reduction Will Propel Bath & Body Works Forward
Fair Value US$40.73|22.0% undervalued
ZW
Community Contributor
An amazing opportunity to potentially get a 100 bagger
Fair Value US$10.00|46.4% overvalued
DA
Community Contributor