Stock Analysis

If you want to compound wealth in the stock market, you can do so by buying an index fund. But you can significantly boost your returns by picking above-average stocks. To wit, the Insurance Australia Group Limited (ASX:IAG) share price is 31% higher than it was a year ago, much better than the market return of around 2.7% (not including dividends) in the same period. If it can keep that out-performance up over the long term, investors will do very well! However, the longer term returns haven't been so impressive, with the stock up just 23% in the last three years.
So let's assess the underlying fundamentals over the last 1 year and see if they've moved in lock-step with shareholder returns.
View our latest analysis for Insurance Australia Group
To paraphrase Benjamin Graham: Over the short term the market is a voting machine, but over the long term it's a weighing machine. One imperfect but simple way to consider how the market perception of a company has shifted is to compare the change in the earnings per share (EPS) with the share price movement.
Insurance Australia Group was able to grow EPS by 141% in the last twelve months. This EPS growth is significantly higher than the 31% increase in the share price. So it seems like the market has cooled on Insurance Australia Group, despite the growth. Interesting.
The graphic below depicts how EPS has changed over time (unveil the exact values by clicking on the image).
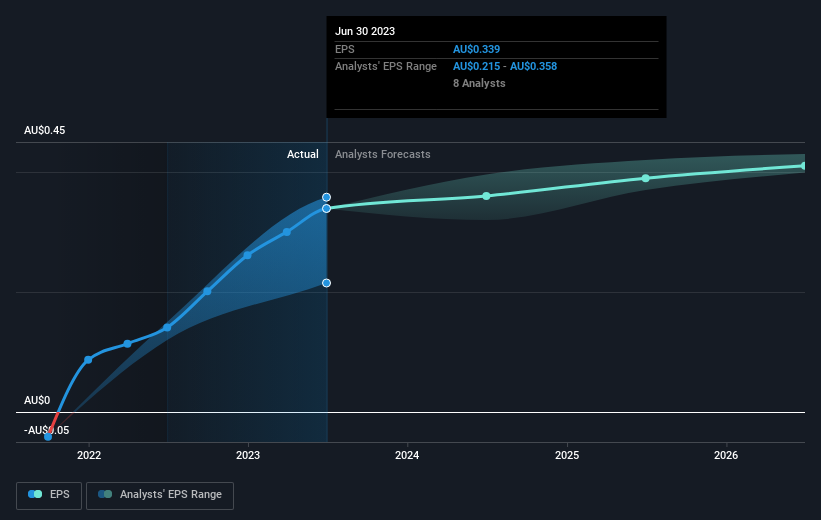
We're pleased to report that the CEO is remunerated more modestly than most CEOs at similarly capitalized companies. But while CEO remuneration is always worth checking, the really important question is whether the company can grow earnings going forward. It might be well worthwhile taking a look at our free report on Insurance Australia Group's earnings, revenue and cash flow.
What About Dividends?
As well as measuring the share price return, investors should also consider the total shareholder return (TSR). The TSR is a return calculation that accounts for the value of cash dividends (assuming that any dividend received was reinvested) and the calculated value of any discounted capital raisings and spin-offs. So for companies that pay a generous dividend, the TSR is often a lot higher than the share price return. In the case of Insurance Australia Group, it has a TSR of 35% for the last 1 year. That exceeds its share price return that we previously mentioned. And there's no prize for guessing that the dividend payments largely explain the divergence!
A Different Perspective
It's nice to see that Insurance Australia Group shareholders have received a total shareholder return of 35% over the last year. Of course, that includes the dividend. Notably the five-year annualised TSR loss of 0.2% per year compares very unfavourably with the recent share price performance. We generally put more weight on the long term performance over the short term, but the recent improvement could hint at a (positive) inflection point within the business. Most investors take the time to check the data on insider transactions. You can click here to see if insiders have been buying or selling.
Of course, you might find a fantastic investment by looking elsewhere. So take a peek at this free list of companies we expect will grow earnings.
Please note, the market returns quoted in this article reflect the market weighted average returns of stocks that currently trade on Australian exchanges.
Valuation is complex, but we're helping make it simple.
Find out whether Insurance Australia Group is potentially over or undervalued by checking out our comprehensive analysis, which includes fair value estimates, risks and warnings, dividends, insider transactions and financial health.
View the Free AnalysisHave feedback on this article? Concerned about the content? Get in touch with us directly. Alternatively, email editorial-team (at) simplywallst.com.
This article by Simply Wall St is general in nature. We provide commentary based on historical data and analyst forecasts only using an unbiased methodology and our articles are not intended to be financial advice. It does not constitute a recommendation to buy or sell any stock, and does not take account of your objectives, or your financial situation. We aim to bring you long-term focused analysis driven by fundamental data. Note that our analysis may not factor in the latest price-sensitive company announcements or qualitative material. Simply Wall St has no position in any stocks mentioned.
About ASX:IAG
Insurance Australia Group
Insurance Australia Group Limited underwrites general insurance products and provides investment management services in Australia and New Zealand.
Excellent balance sheet with proven track record.

