Stock Analysis

The most you can lose on any stock (assuming you don't use leverage) is 100% of your money. But on the bright side, you can make far more than 100% on a really good stock. One great example is AUB Group Limited (ASX:AUB) which saw its share price drive 128% higher over five years. Also pleasing for shareholders was the 13% gain in the last three months. The company reported its financial results recently; you can catch up on the latest numbers by reading our company report.
With that in mind, it's worth seeing if the company's underlying fundamentals have been the driver of long term performance, or if there are some discrepancies.
Check out our latest analysis for AUB Group
To paraphrase Benjamin Graham: Over the short term the market is a voting machine, but over the long term it's a weighing machine. One flawed but reasonable way to assess how sentiment around a company has changed is to compare the earnings per share (EPS) with the share price.
During five years of share price growth, AUB Group achieved compound earnings per share (EPS) growth of 10% per year. This EPS growth is lower than the 18% average annual increase in the share price. So it's fair to assume the market has a higher opinion of the business than it did five years ago. And that's hardly shocking given the track record of growth.
You can see below how EPS has changed over time (discover the exact values by clicking on the image).
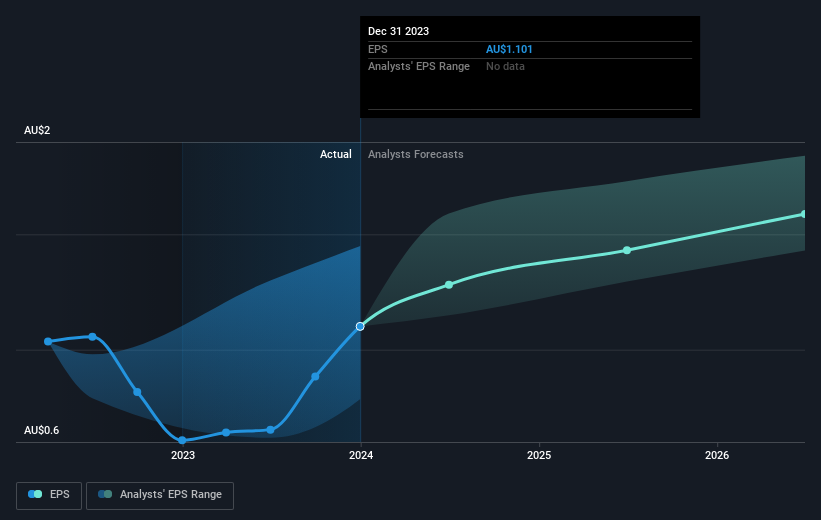
We know that AUB Group has improved its bottom line lately, but is it going to grow revenue? Check if analysts think AUB Group will grow revenue in the future.
What About Dividends?
As well as measuring the share price return, investors should also consider the total shareholder return (TSR). Whereas the share price return only reflects the change in the share price, the TSR includes the value of dividends (assuming they were reinvested) and the benefit of any discounted capital raising or spin-off. So for companies that pay a generous dividend, the TSR is often a lot higher than the share price return. We note that for AUB Group the TSR over the last 5 years was 168%, which is better than the share price return mentioned above. The dividends paid by the company have thusly boosted the total shareholder return.
A Different Perspective
It's good to see that AUB Group has rewarded shareholders with a total shareholder return of 21% in the last twelve months. That's including the dividend. However, the TSR over five years, coming in at 22% per year, is even more impressive. I find it very interesting to look at share price over the long term as a proxy for business performance. But to truly gain insight, we need to consider other information, too. Consider risks, for instance. Every company has them, and we've spotted 2 warning signs for AUB Group you should know about.
We will like AUB Group better if we see some big insider buys. While we wait, check out this free list of growing companies with considerable, recent, insider buying.
Please note, the market returns quoted in this article reflect the market weighted average returns of stocks that currently trade on Australian exchanges.
Valuation is complex, but we're helping make it simple.
Find out whether AUB Group is potentially over or undervalued by checking out our comprehensive analysis, which includes fair value estimates, risks and warnings, dividends, insider transactions and financial health.
View the Free AnalysisHave feedback on this article? Concerned about the content? Get in touch with us directly. Alternatively, email editorial-team (at) simplywallst.com.
This article by Simply Wall St is general in nature. We provide commentary based on historical data and analyst forecasts only using an unbiased methodology and our articles are not intended to be financial advice. It does not constitute a recommendation to buy or sell any stock, and does not take account of your objectives, or your financial situation. We aim to bring you long-term focused analysis driven by fundamental data. Note that our analysis may not factor in the latest price-sensitive company announcements or qualitative material. Simply Wall St has no position in any stocks mentioned.
About ASX:AUB
AUB Group
AUB Group Limited engages in the insurance broking and underwriting businesses in Australia and New Zealand.
Proven track record average dividend payer.

