
Advertisement
- Australia
- /
- Medical Equipment
- /
- ASX:SOM
SomnoMed Limited's (ASX:SOM) 29% Dip In Price Shows Sentiment Is Matching Revenues
To the annoyance of some shareholders, SomnoMed Limited (ASX:SOM) shares are down a considerable 29% in the last month, which continues a horrid run for the company. Looking at the bigger picture, even after this poor month the stock is up 100% in the last year.
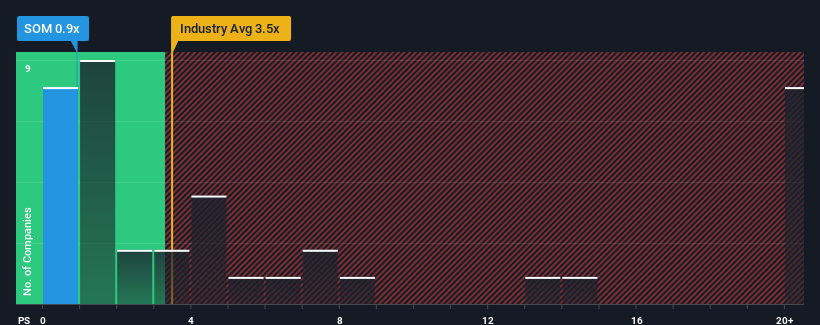
Following the heavy fall in price, SomnoMed may be sending very bullish signals at the moment with its price-to-sales (or "P/S") ratio of 0.9x, since almost half of all companies in the Medical Equipment industry in Australia have P/S ratios greater than 3.5x and even P/S higher than 8x are not unusual. Although, it's not wise to just take the P/S at face value as there may be an explanation why it's so limited.
We've discovered 3 warning signs about SomnoMed. View them for free.See our latest analysis for SomnoMed
What Does SomnoMed's P/S Mean For Shareholders?
Recent times have been advantageous for SomnoMed as its revenues have been rising faster than most other companies. One possibility is that the P/S ratio is low because investors think this strong revenue performance might be less impressive moving forward. If you like the company, you'd be hoping this isn't the case so that you could potentially pick up some stock while it's out of favour.
Want the full picture on analyst estimates for the company? Then our free report on SomnoMed will help you uncover what's on the horizon.What Are Revenue Growth Metrics Telling Us About The Low P/S?
SomnoMed's P/S ratio would be typical for a company that's expected to deliver very poor growth or even falling revenue, and importantly, perform much worse than the industry.
Retrospectively, the last year delivered a decent 13% gain to the company's revenues. This was backed up an excellent period prior to see revenue up by 52% in total over the last three years. Accordingly, shareholders would have definitely welcomed those medium-term rates of revenue growth.
Turning to the outlook, the next year should generate growth of 13% as estimated by the only analyst watching the company. Meanwhile, the rest of the industry is forecast to expand by 18%, which is noticeably more attractive.
In light of this, it's understandable that SomnoMed's P/S sits below the majority of other companies. It seems most investors are expecting to see limited future growth and are only willing to pay a reduced amount for the stock.
What Does SomnoMed's P/S Mean For Investors?
Having almost fallen off a cliff, SomnoMed's share price has pulled its P/S way down as well. While the price-to-sales ratio shouldn't be the defining factor in whether you buy a stock or not, it's quite a capable barometer of revenue expectations.
As expected, our analysis of SomnoMed's analyst forecasts confirms that the company's underwhelming revenue outlook is a major contributor to its low P/S. At this stage investors feel the potential for an improvement in revenue isn't great enough to justify a higher P/S ratio. It's hard to see the share price rising strongly in the near future under these circumstances.
Don't forget that there may be other risks. For instance, we've identified 3 warning signs for SomnoMed (2 make us uncomfortable) you should be aware of.
If strong companies turning a profit tickle your fancy, then you'll want to check out this free list of interesting companies that trade on a low P/E (but have proven they can grow earnings).
New: Manage All Your Stock Portfolios in One Place
We've created the ultimate portfolio companion for stock investors, and it's free.
• Connect an unlimited number of Portfolios and see your total in one currency
• Be alerted to new Warning Signs or Risks via email or mobile
• Track the Fair Value of your stocks
Have feedback on this article? Concerned about the content? Get in touch with us directly. Alternatively, email editorial-team (at) simplywallst.com.
This article by Simply Wall St is general in nature. We provide commentary based on historical data and analyst forecasts only using an unbiased methodology and our articles are not intended to be financial advice. It does not constitute a recommendation to buy or sell any stock, and does not take account of your objectives, or your financial situation. We aim to bring you long-term focused analysis driven by fundamental data. Note that our analysis may not factor in the latest price-sensitive company announcements or qualitative material. Simply Wall St has no position in any stocks mentioned.
About ASX:SOM
SomnoMed
SomnoMed Limited, together with its subsidiaries, produce and sells devices for the oral treatment of sleep related disorders in the Asia Pacific region, North America, and Europe.
Flawless balance sheet and undervalued.
Similar Companies
Market Insights

Advertisement
Community Narratives
The Next Phase of Energy Storage: How NeoVolta Is Tackling America’s Power Crunch
Fair Value US$7.50|35.2% undervalued
MA
Community Contributor
Why EnSilica is Worth Possibly 13x its Current Price
Fair Value UK£5.00|90.0% undervalued
DO
Community Contributor
M&A Activity, Industry Diversification & A Defense Contract Monopoly Will Push BWXT For Healthy Long-Term Growth
Fair Value US$220.00|15.6% undervalued
CL
Community Contributor
A case for Cassiar Gold Corp (TSXV: GLDC) to reach CAD$8-10 before 2030 (X30-37)
Fair Value CA$10.00|97.1% undervalued
AG
Community Contributor