
Advertisement
- Australia
- /
- Healthcare Services
- /
- ASX:PSQ
Market Participants Recognise Pacific Smiles Group Limited's (ASX:PSQ) Revenues Pushing Shares 58% Higher

Pacific Smiles Group Limited (ASX:PSQ) shareholders would be excited to see that the share price has had a great month, posting a 58% gain and recovering from prior weakness. But the gains over the last month weren't enough to make shareholders whole, as the share price is still down 8.8% in the last twelve months.
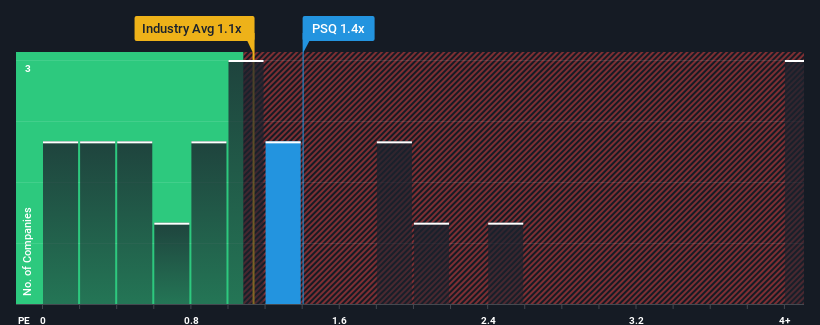
Even after such a large jump in price, there still wouldn't be many who think Pacific Smiles Group's price-to-sales (or "P/S") ratio of 1.4x is worth a mention when the median P/S in Australia's Healthcare industry is similar at about 1.1x. However, investors might be overlooking a clear opportunity or potential setback if there is no rational basis for the P/S.
Check out our latest analysis for Pacific Smiles Group
What Does Pacific Smiles Group's Recent Performance Look Like?
Pacific Smiles Group certainly has been doing a good job lately as its revenue growth has been positive while most other companies have been seeing their revenue go backwards. It might be that many expect the strong revenue performance to deteriorate like the rest, which has kept the P/S ratio from rising. Those who are bullish on Pacific Smiles Group will be hoping that this isn't the case, so that they can pick up the stock at a slightly lower valuation.
Want the full picture on analyst estimates for the company? Then our free report on Pacific Smiles Group will help you uncover what's on the horizon.Do Revenue Forecasts Match The P/S Ratio?
In order to justify its P/S ratio, Pacific Smiles Group would need to produce growth that's similar to the industry.
Taking a look back first, we see that the company grew revenue by an impressive 19% last year. The strong recent performance means it was also able to grow revenue by 38% in total over the last three years. So we can start by confirming that the company has done a great job of growing revenue over that time.
Looking ahead now, revenue is anticipated to climb by 9.1% per year during the coming three years according to the three analysts following the company. With the industry predicted to deliver 7.3% growth each year, the company is positioned for a comparable revenue result.
In light of this, it's understandable that Pacific Smiles Group's P/S sits in line with the majority of other companies. Apparently shareholders are comfortable to simply hold on while the company is keeping a low profile.
The Final Word
Its shares have lifted substantially and now Pacific Smiles Group's P/S is back within range of the industry median. It's argued the price-to-sales ratio is an inferior measure of value within certain industries, but it can be a powerful business sentiment indicator.
Our look at Pacific Smiles Group's revenue growth estimates show that its P/S is about what we expect, as both metrics follow closely with the industry averages. Right now shareholders are comfortable with the P/S as they are quite confident future revenue won't throw up any surprises. If all things remain constant, the possibility of a drastic share price movement remains fairly remote.
The company's balance sheet is another key area for risk analysis. You can assess many of the main risks through our free balance sheet analysis for Pacific Smiles Group with six simple checks.
If strong companies turning a profit tickle your fancy, then you'll want to check out this free list of interesting companies that trade on a low P/E (but have proven they can grow earnings).
New: Manage All Your Stock Portfolios in One Place
We've created the ultimate portfolio companion for stock investors, and it's free.
• Connect an unlimited number of Portfolios and see your total in one currency
• Be alerted to new Warning Signs or Risks via email or mobile
• Track the Fair Value of your stocks
Have feedback on this article? Concerned about the content? Get in touch with us directly. Alternatively, email editorial-team (at) simplywallst.com.
This article by Simply Wall St is general in nature. We provide commentary based on historical data and analyst forecasts only using an unbiased methodology and our articles are not intended to be financial advice. It does not constitute a recommendation to buy or sell any stock, and does not take account of your objectives, or your financial situation. We aim to bring you long-term focused analysis driven by fundamental data. Note that our analysis may not factor in the latest price-sensitive company announcements or qualitative material. Simply Wall St has no position in any stocks mentioned.
About ASX:PSQ
Pacific Smiles Group
Owns and operates dental centers under the Pacific Smiles Dental Centres and Nib Dental Care Centres names in Australia.
High growth potential with adequate balance sheet.
Market Insights

Advertisement
Community Narratives

BMW cruising ahead with new EVs and premium models to boost revenue 5%
Fair Value €135.07|45.0% undervalued
UN
Community Contributor
EU#2 - From Humble Beginnings to Global Powerhouse
Fair Value DKK 851.04|48.9% undervalued
TO
Community Contributor