
Advertisement
- Australia
- /
- Medical Equipment
- /
- ASX:EBR
EBR Systems, Inc.'s (ASX:EBR) Intrinsic Value Is Potentially 31% Above Its Share Price

Key Insights
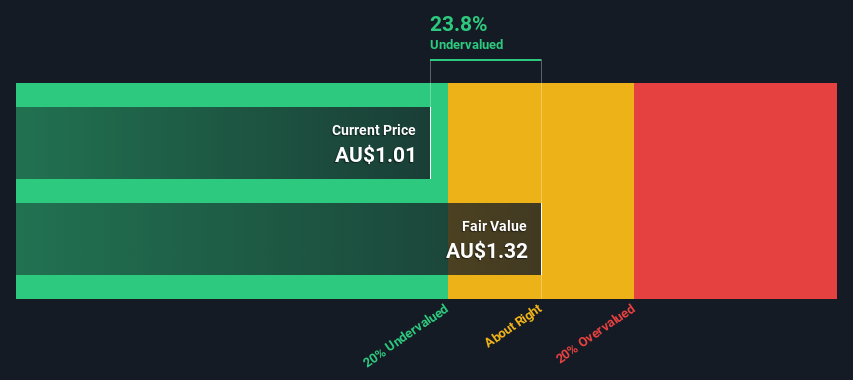
- Using the 2 Stage Free Cash Flow to Equity, EBR Systems fair value estimate is AU$1.32
- Current share price of AU$1.01 suggests EBR Systems is potentially 24% undervalued
- Our fair value estimate is 9.3% lower than EBR Systems' analyst price target of US$1.45
Today we'll do a simple run through of a valuation method used to estimate the attractiveness of EBR Systems, Inc. (ASX:EBR) as an investment opportunity by taking the expected future cash flows and discounting them to their present value. One way to achieve this is by employing the Discounted Cash Flow (DCF) model. It may sound complicated, but actually it is quite simple!
Remember though, that there are many ways to estimate a company's value, and a DCF is just one method. Anyone interested in learning a bit more about intrinsic value should have a read of the Simply Wall St analysis model.
View our latest analysis for EBR Systems
Is EBR Systems Fairly Valued?
We are going to use a two-stage DCF model, which, as the name states, takes into account two stages of growth. The first stage is generally a higher growth period which levels off heading towards the terminal value, captured in the second 'steady growth' period. To begin with, we have to get estimates of the next ten years of cash flows. Where possible we use analyst estimates, but when these aren't available we extrapolate the previous free cash flow (FCF) from the last estimate or reported value. We assume companies with shrinking free cash flow will slow their rate of shrinkage, and that companies with growing free cash flow will see their growth rate slow, over this period. We do this to reflect that growth tends to slow more in the early years than it does in later years.
A DCF is all about the idea that a dollar in the future is less valuable than a dollar today, and so the sum of these future cash flows is then discounted to today's value:
10-year free cash flow (FCF) estimate
| 2025 | 2026 | 2027 | 2028 | 2029 | 2030 | 2031 | 2032 | 2033 | 2034 | |
| Levered FCF ($, Millions) | -US$39.8m | -US$34.4m | -US$30.9m | US$7.80m | US$10.7m | US$13.5m | US$16.2m | US$18.5m | US$20.4m | US$22.1m |
| Growth Rate Estimate Source | Analyst x2 | Analyst x2 | Analyst x1 | Analyst x1 | Est @ 37.04% | Est @ 26.65% | Est @ 19.38% | Est @ 14.29% | Est @ 10.72% | Est @ 8.23% |
| Present Value ($, Millions) Discounted @ 6.6% | -US$37.4 | -US$30.3 | -US$25.5 | US$6.0 | US$7.8 | US$9.2 | US$10.4 | US$11.1 | US$11.5 | US$11.7 |
("Est" = FCF growth rate estimated by Simply Wall St)
Present Value of 10-year Cash Flow (PVCF) = -US$25m
We now need to calculate the Terminal Value, which accounts for all the future cash flows after this ten year period. The Gordon Growth formula is used to calculate Terminal Value at a future annual growth rate equal to the 5-year average of the 10-year government bond yield of 2.4%. We discount the terminal cash flows to today's value at a cost of equity of 6.6%.
Terminal Value (TV)= FCF2034 × (1 + g) ÷ (r – g) = US$22m× (1 + 2.4%) ÷ (6.6%– 2.4%) = US$546m
Present Value of Terminal Value (PVTV)= TV / (1 + r)10= US$546m÷ ( 1 + 6.6%)10= US$289m
The total value is the sum of cash flows for the next ten years plus the discounted terminal value, which results in the Total Equity Value, which in this case is US$263m. The last step is to then divide the equity value by the number of shares outstanding. Compared to the current share price of AU$1.0, the company appears a touch undervalued at a 24% discount to where the stock price trades currently. The assumptions in any calculation have a big impact on the valuation, so it is better to view this as a rough estimate, not precise down to the last cent.
Important Assumptions
We would point out that the most important inputs to a discounted cash flow are the discount rate and of course the actual cash flows. You don't have to agree with these inputs, I recommend redoing the calculations yourself and playing with them. The DCF also does not consider the possible cyclicality of an industry, or a company's future capital requirements, so it does not give a full picture of a company's potential performance. Given that we are looking at EBR Systems as potential shareholders, the cost of equity is used as the discount rate, rather than the cost of capital (or weighted average cost of capital, WACC) which accounts for debt. In this calculation we've used 6.6%, which is based on a levered beta of 1.008. Beta is a measure of a stock's volatility, compared to the market as a whole. We get our beta from the industry average beta of globally comparable companies, with an imposed limit between 0.8 and 2.0, which is a reasonable range for a stable business.
SWOT Analysis for EBR Systems
Strength
- Debt is well covered by earnings.
Weakness
- No major weaknesses identified for EBR.
Opportunity
- Trading below our estimate of fair value by more than 20%.
Threat
- Debt is not well covered by operating cash flow.
- Has less than 3 years of cash runway based on current free cash flow.
- Not expected to become profitable over the next 3 years.
Looking Ahead:
Valuation is only one side of the coin in terms of building your investment thesis, and it ideally won't be the sole piece of analysis you scrutinize for a company. The DCF model is not a perfect stock valuation tool. Preferably you'd apply different cases and assumptions and see how they would impact the company's valuation. If a company grows at a different rate, or if its cost of equity or risk free rate changes sharply, the output can look very different. What is the reason for the share price sitting below the intrinsic value? For EBR Systems, there are three additional factors you should assess:
- Risks: Consider for instance, the ever-present spectre of investment risk. We've identified 2 warning signs with EBR Systems (at least 1 which is potentially serious) , and understanding these should be part of your investment process.
- Future Earnings: How does EBR's growth rate compare to its peers and the wider market? Dig deeper into the analyst consensus number for the upcoming years by interacting with our free analyst growth expectation chart.
- Other Solid Businesses: Low debt, high returns on equity and good past performance are fundamental to a strong business. Why not explore our interactive list of stocks with solid business fundamentals to see if there are other companies you may not have considered!
PS. The Simply Wall St app conducts a discounted cash flow valuation for every stock on the ASX every day. If you want to find the calculation for other stocks just search here.
Valuation is complex, but we're here to simplify it.
Discover if EBR Systems might be undervalued or overvalued with our detailed analysis, featuring fair value estimates, potential risks, dividends, insider trades, and its financial condition.
Access Free AnalysisHave feedback on this article? Concerned about the content? Get in touch with us directly. Alternatively, email editorial-team (at) simplywallst.com.
This article by Simply Wall St is general in nature. We provide commentary based on historical data and analyst forecasts only using an unbiased methodology and our articles are not intended to be financial advice. It does not constitute a recommendation to buy or sell any stock, and does not take account of your objectives, or your financial situation. We aim to bring you long-term focused analysis driven by fundamental data. Note that our analysis may not factor in the latest price-sensitive company announcements or qualitative material. Simply Wall St has no position in any stocks mentioned.
Have feedback on this article? Concerned about the content? Get in touch with us directly. Alternatively, email editorial-team@simplywallst.com
About ASX:EBR
EBR Systems
Develops implantable systems for wireless tissue stimulation.
Excellent balance sheet slight.
Market Insights


Advertisement
Community Narratives
Suncorp’s Next Chapter: Insurance-Only and Ready to Grow
Fair Value AU$22.83|5.7% undervalued
RO
Community Contributor
Thyssenkrupp Nucera Will Achieve Double-Digit Profits by 2030 Boosted by Hydrogen Growth
Fair Value €14.40|31.6% undervalued
CH
Community Contributor
Tesla’s Nvidia Moment – The AI & Robotics Inflection Point
Fair Value US$384.84|18.0% undervalued
BL
Community Contributor