Top Shelf International Holdings Ltd's (ASX:TSI) Stock Retreats 42% But Revenues Haven't Escaped The Attention Of Investors


To the annoyance of some shareholders, Top Shelf International Holdings Ltd (ASX:TSI) shares are down a considerable 42% in the last month, which continues a horrid run for the company. The recent drop completes a disastrous twelve months for shareholders, who are sitting on a 59% loss during that time.
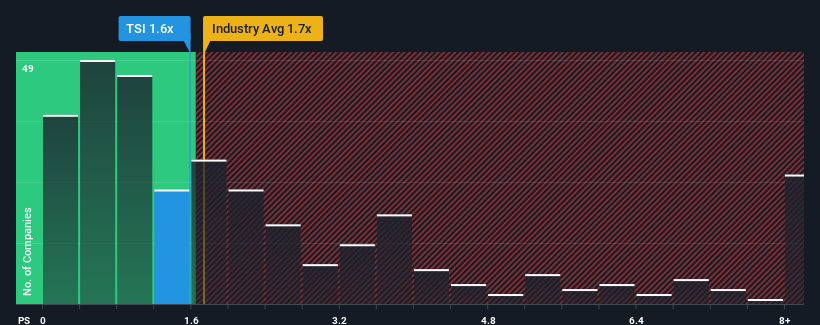
Although its price has dipped substantially, when almost half of the companies in Australia's Beverage industry have price-to-sales ratios (or "P/S") below 1x, you may still consider Top Shelf International Holdings as a stock probably not worth researching with its 1.6x P/S ratio. Nonetheless, we'd need to dig a little deeper to determine if there is a rational basis for the elevated P/S.
Check out our latest analysis for Top Shelf International Holdings
What Does Top Shelf International Holdings' Recent Performance Look Like?
Revenue has risen firmly for Top Shelf International Holdings recently, which is pleasing to see. It might be that many expect the respectable revenue performance to beat most other companies over the coming period, which has increased investors’ willingness to pay up for the stock. However, if this isn't the case, investors might get caught out paying too much for the stock.
Although there are no analyst estimates available for Top Shelf International Holdings, take a look at this free data-rich visualisation to see how the company stacks up on earnings, revenue and cash flow.Is There Enough Revenue Growth Forecasted For Top Shelf International Holdings?
The only time you'd be truly comfortable seeing a P/S as high as Top Shelf International Holdings' is when the company's growth is on track to outshine the industry.
Taking a look back first, we see that the company managed to grow revenues by a handy 10% last year. The latest three year period has also seen an excellent 142% overall rise in revenue, aided somewhat by its short-term performance. So we can start by confirming that the company has done a great job of growing revenues over that time.
Comparing that recent medium-term revenue trajectory with the industry's one-year growth forecast of 18% shows it's noticeably more attractive.
With this information, we can see why Top Shelf International Holdings is trading at such a high P/S compared to the industry. Presumably shareholders aren't keen to offload something they believe will continue to outmanoeuvre the wider industry.
The Final Word
Top Shelf International Holdings' P/S remain high even after its stock plunged. It's argued the price-to-sales ratio is an inferior measure of value within certain industries, but it can be a powerful business sentiment indicator.
It's no surprise that Top Shelf International Holdings can support its high P/S given the strong revenue growth its experienced over the last three-year is superior to the current industry outlook. Right now shareholders are comfortable with the P/S as they are quite confident revenue aren't under threat. If recent medium-term revenue trends continue, it's hard to see the share price falling strongly in the near future under these circumstances.
We don't want to rain on the parade too much, but we did also find 4 warning signs for Top Shelf International Holdings (3 make us uncomfortable!) that you need to be mindful of.
It's important to make sure you look for a great company, not just the first idea you come across. So if growing profitability aligns with your idea of a great company, take a peek at this free list of interesting companies with strong recent earnings growth (and a low P/E).
If you're looking to trade Top Shelf International Holdings, open an account with the lowest-cost platform trusted by professionals, Interactive Brokers.
With clients in over 200 countries and territories, and access to 160 markets, IBKR lets you trade stocks, options, futures, forex, bonds and funds from a single integrated account.
Enjoy no hidden fees, no account minimums, and FX conversion rates as low as 0.03%, far better than what most brokers offer.
Sponsored ContentValuation is complex, but we're here to simplify it.
Discover if Top Shelf International Holdings might be undervalued or overvalued with our detailed analysis, featuring fair value estimates, potential risks, dividends, insider trades, and its financial condition.
Access Free AnalysisHave feedback on this article? Concerned about the content? Get in touch with us directly. Alternatively, email editorial-team (at) simplywallst.com.
This article by Simply Wall St is general in nature. We provide commentary based on historical data and analyst forecasts only using an unbiased methodology and our articles are not intended to be financial advice. It does not constitute a recommendation to buy or sell any stock, and does not take account of your objectives, or your financial situation. We aim to bring you long-term focused analysis driven by fundamental data. Note that our analysis may not factor in the latest price-sensitive company announcements or qualitative material. Simply Wall St has no position in any stocks mentioned.
About ASX:TSI
Top Shelf International Holdings
Engages in the production, marketing, and selling of NED Australian Whisky and Grainshaker Hand Made Vodka spirit products in Australia.
Moderate and slightly overvalued.
Market Insights

Community Narratives

