
Advertisement
Here's What's Concerning About Inghams Group's (ASX:ING) Returns On Capital

What trends should we look for it we want to identify stocks that can multiply in value over the long term? Firstly, we'd want to identify a growing return on capital employed (ROCE) and then alongside that, an ever-increasing base of capital employed. Ultimately, this demonstrates that it's a business that is reinvesting profits at increasing rates of return. However, after briefly looking over the numbers, we don't think Inghams Group (ASX:ING) has the makings of a multi-bagger going forward, but let's have a look at why that may be.
Understanding Return On Capital Employed (ROCE)
For those that aren't sure what ROCE is, it measures the amount of pre-tax profits a company can generate from the capital employed in its business. The formula for this calculation on Inghams Group is:
Return on Capital Employed = Earnings Before Interest and Tax (EBIT) ÷ (Total Assets - Current Liabilities)
0.12 = AU$221m ÷ (AU$2.6b - AU$748m) (Based on the trailing twelve months to December 2023).
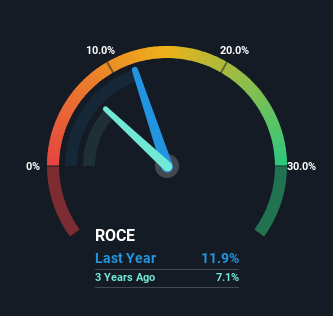
So, Inghams Group has an ROCE of 12%. That's a relatively normal return on capital, and it's around the 11% generated by the Food industry.
See our latest analysis for Inghams Group
In the above chart we have measured Inghams Group's prior ROCE against its prior performance, but the future is arguably more important. If you'd like to see what analysts are forecasting going forward, you should check out our free analyst report for Inghams Group .
The Trend Of ROCE
When we looked at the ROCE trend at Inghams Group, we didn't gain much confidence. To be more specific, ROCE has fallen from 23% over the last five years. However, given capital employed and revenue have both increased it appears that the business is currently pursuing growth, at the consequence of short term returns. And if the increased capital generates additional returns, the business, and thus shareholders, will benefit in the long run.
On a side note, Inghams Group has done well to pay down its current liabilities to 29% of total assets. So we could link some of this to the decrease in ROCE. What's more, this can reduce some aspects of risk to the business because now the company's suppliers or short-term creditors are funding less of its operations. Some would claim this reduces the business' efficiency at generating ROCE since it is now funding more of the operations with its own money.
What We Can Learn From Inghams Group's ROCE
Even though returns on capital have fallen in the short term, we find it promising that revenue and capital employed have both increased for Inghams Group. In light of this, the stock has only gained 3.2% over the last five years. Therefore we'd recommend looking further into this stock to confirm if it has the makings of a good investment.
One final note, you should learn about the 2 warning signs we've spotted with Inghams Group (including 1 which is significant) .
While Inghams Group isn't earning the highest return, check out this free list of companies that are earning high returns on equity with solid balance sheets.
New: AI Stock Screener & Alerts
Our new AI Stock Screener scans the market every day to uncover opportunities.
• Dividend Powerhouses (3%+ Yield)
• Undervalued Small Caps with Insider Buying
• High growth Tech and AI Companies
Or build your own from over 50 metrics.
Have feedback on this article? Concerned about the content? Get in touch with us directly. Alternatively, email editorial-team (at) simplywallst.com.
This article by Simply Wall St is general in nature. We provide commentary based on historical data and analyst forecasts only using an unbiased methodology and our articles are not intended to be financial advice. It does not constitute a recommendation to buy or sell any stock, and does not take account of your objectives, or your financial situation. We aim to bring you long-term focused analysis driven by fundamental data. Note that our analysis may not factor in the latest price-sensitive company announcements or qualitative material. Simply Wall St has no position in any stocks mentioned.
About ASX:ING
Inghams Group
Produces and sells chicken and turkey products under the Ingham’s brand in Australia and New Zealand.
Undervalued with mediocre balance sheet.
Similar Companies
Market Insights

Advertisement
Community Narratives
WhiteCap Is Positioned To Profit Regardless Of Trump's Policy 
Fair Value CA$22.60|61.5% undervalued
ST
Equity Analyst and Writer
Microsoft's Evolution Will Drive Revenue to New Heights Fueled by AI
Fair Value US$360.00|30.7% overvalued
BR
Community Contributor
A CASE FOR USD$2.50 (CAD$3.44) BY 2028 (A 5-10 BAGGER)
Fair Value CA$3.44|88.1% undervalued
AG
Community Contributor