
Advertisement
- Australia
- /
- Oil and Gas
- /
- ASX:VEA
Viva Energy Group (ASX:VEA) shareholders have endured a 28% loss from investing in the stock a year ago
While it may not be enough for some shareholders, we think it is good to see the Viva Energy Group Limited (ASX:VEA) share price up 27% in a single quarter. But in truth the last year hasn't been good for the share price. The cold reality is that the stock has dropped 32% in one year, under-performing the market.
So let's have a look and see if the longer term performance of the company has been in line with the underlying business' progress.
While the efficient markets hypothesis continues to be taught by some, it has been proven that markets are over-reactive dynamic systems, and investors are not always rational. One imperfect but simple way to consider how the market perception of a company has shifted is to compare the change in the earnings per share (EPS) with the share price movement.
During the last year Viva Energy Group saw its earnings per share drop below zero. Buyers no doubt think it's a temporary situation, but those with a nose for quality have low tolerance for losses. Of course, if the company can turn the situation around, investors will likely profit.
The graphic below depicts how EPS has changed over time (unveil the exact values by clicking on the image).
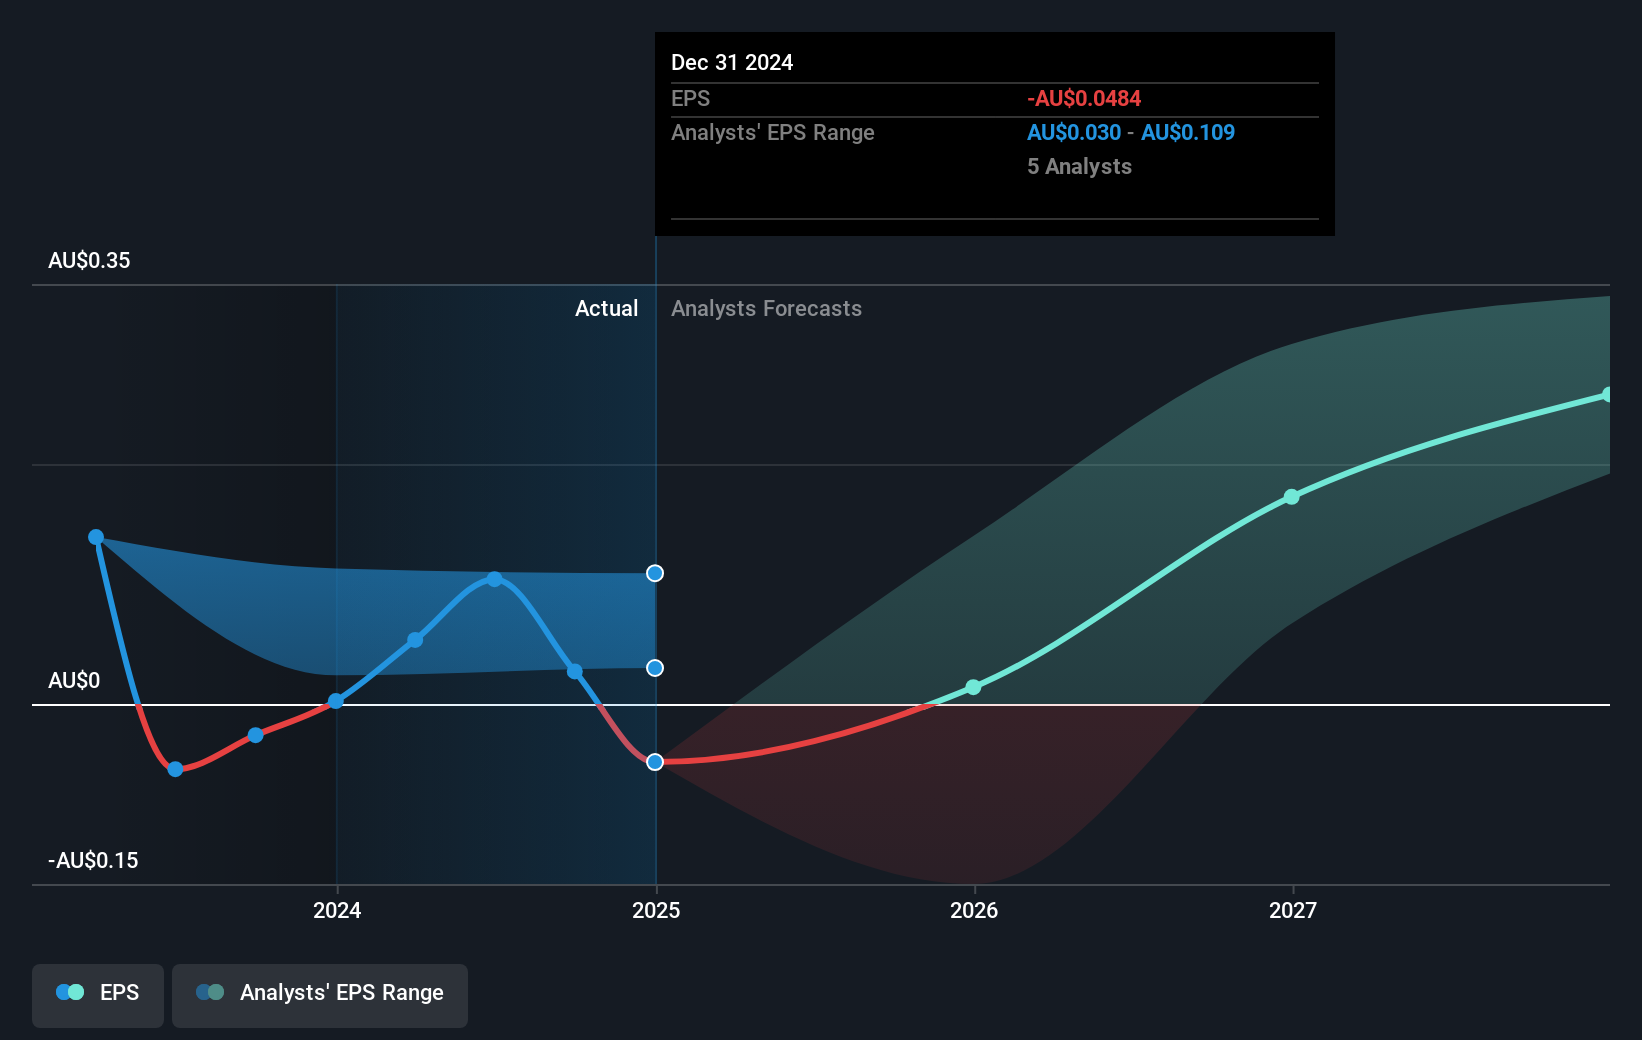
We like that insiders have been buying shares in the last twelve months. Even so, future earnings will be far more important to whether current shareholders make money. Dive deeper into the earnings by checking this interactive graph of Viva Energy Group's earnings, revenue and cash flow.
What About Dividends?
It is important to consider the total shareholder return, as well as the share price return, for any given stock. Whereas the share price return only reflects the change in the share price, the TSR includes the value of dividends (assuming they were reinvested) and the benefit of any discounted capital raising or spin-off. Arguably, the TSR gives a more comprehensive picture of the return generated by a stock. We note that for Viva Energy Group the TSR over the last 1 year was -28%, which is better than the share price return mentioned above. The dividends paid by the company have thusly boosted the total shareholder return.
A Different Perspective
Viva Energy Group shareholders are down 28% for the year (even including dividends), but the market itself is up 13%. However, keep in mind that even the best stocks will sometimes underperform the market over a twelve month period. On the bright side, long term shareholders have made money, with a gain of 9% per year over half a decade. It could be that the recent sell-off is an opportunity, so it may be worth checking the fundamental data for signs of a long term growth trend. I find it very interesting to look at share price over the long term as a proxy for business performance. But to truly gain insight, we need to consider other information, too. Case in point: We've spotted 2 warning signs for Viva Energy Group you should be aware of.
Viva Energy Group is not the only stock that insiders are buying. For those who like to find lesser know companies this free list of growing companies with recent insider purchasing, could be just the ticket.
Please note, the market returns quoted in this article reflect the market weighted average returns of stocks that currently trade on Australian exchanges.
New: Manage All Your Stock Portfolios in One Place
We've created the ultimate portfolio companion for stock investors, and it's free.
• Connect an unlimited number of Portfolios and see your total in one currency
• Be alerted to new Warning Signs or Risks via email or mobile
• Track the Fair Value of your stocks
Have feedback on this article? Concerned about the content? Get in touch with us directly. Alternatively, email editorial-team (at) simplywallst.com.
This article by Simply Wall St is general in nature. We provide commentary based on historical data and analyst forecasts only using an unbiased methodology and our articles are not intended to be financial advice. It does not constitute a recommendation to buy or sell any stock, and does not take account of your objectives, or your financial situation. We aim to bring you long-term focused analysis driven by fundamental data. Note that our analysis may not factor in the latest price-sensitive company announcements or qualitative material. Simply Wall St has no position in any stocks mentioned.
About ASX:VEA
Viva Energy Group
Operates as an energy company in Australia, Singapore, and Papua New Guinea.
Undervalued with reasonable growth potential.
Similar Companies
Market Insights

Advertisement
Community Narratives
MINISO's fair value is projected at 26.69 with an anticipated PE ratio shift of 20x
Fair Value US$24.03|11.0% undervalued
BE
Community Contributor
Procter & Gamble: A Dividend Giant Facing Slowing Growth
Fair Value US$119.81|23.3% overvalued
AN
Community Contributor
Eli Lilly's Future Growth Driven by Tirzepatide and Favorable Market Conditions
Fair Value US$1.19k|13.8% undervalued
EA
Community Contributor