- Australia
- /
- Oil and Gas
- /
- ASX:VEA
Improved Revenues Required Before Viva Energy Group Limited (ASX:VEA) Stock's 27% Jump Looks Justified
Viva Energy Group Limited (ASX:VEA) shareholders are no doubt pleased to see that the share price has bounced 27% in the last month, although it is still struggling to make up recently lost ground. Not all shareholders will be feeling jubilant, since the share price is still down a very disappointing 45% in the last twelve months.
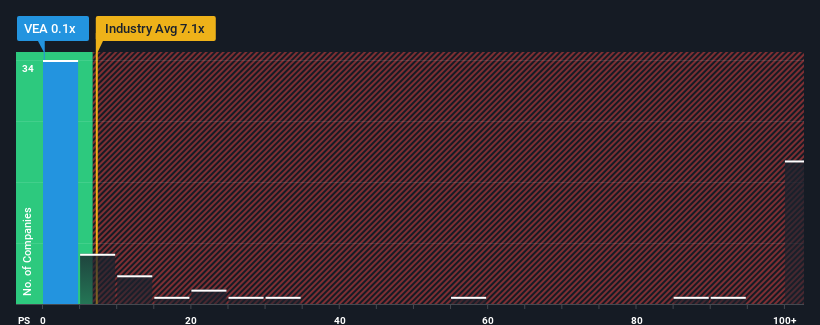
Even after such a large jump in price, Viva Energy Group may still look like a strong buying opportunity at present with its price-to-sales (or "P/S") ratio of 0.1x, considering almost half of all companies in the Oil and Gas industry in Australia have P/S ratios greater than 7.2x and even P/S higher than 150x aren't out of the ordinary. Nonetheless, we'd need to dig a little deeper to determine if there is a rational basis for the highly reduced P/S.
Our free stock report includes 2 warning signs investors should be aware of before investing in Viva Energy Group. Read for free now.See our latest analysis for Viva Energy Group

How Has Viva Energy Group Performed Recently?
Viva Energy Group certainly has been doing a good job lately as its revenue growth has been positive while most other companies have been seeing their revenue go backwards. It might be that many expect the strong revenue performance to degrade substantially, possibly more than the industry, which has repressed the P/S. If not, then existing shareholders have reason to be quite optimistic about the future direction of the share price.
Want the full picture on analyst estimates for the company? Then our free report on Viva Energy Group will help you uncover what's on the horizon.What Are Revenue Growth Metrics Telling Us About The Low P/S?
There's an inherent assumption that a company should far underperform the industry for P/S ratios like Viva Energy Group's to be considered reasonable.
If we review the last year of revenue growth, the company posted a worthy increase of 13%. This was backed up an excellent period prior to see revenue up by 90% in total over the last three years. Accordingly, shareholders would have definitely welcomed those medium-term rates of revenue growth.
Shifting to the future, estimates from the ten analysts covering the company suggest revenue should grow by 1.4% per year over the next three years. Meanwhile, the rest of the industry is forecast to expand by 1,076% each year, which is noticeably more attractive.
In light of this, it's understandable that Viva Energy Group's P/S sits below the majority of other companies. Apparently many shareholders weren't comfortable holding on while the company is potentially eyeing a less prosperous future.
The Final Word
Shares in Viva Energy Group have risen appreciably however, its P/S is still subdued. While the price-to-sales ratio shouldn't be the defining factor in whether you buy a stock or not, it's quite a capable barometer of revenue expectations.
As expected, our analysis of Viva Energy Group's analyst forecasts confirms that the company's underwhelming revenue outlook is a major contributor to its low P/S. At this stage investors feel the potential for an improvement in revenue isn't great enough to justify a higher P/S ratio. The company will need a change of fortune to justify the P/S rising higher in the future.
You should always think about risks. Case in point, we've spotted 2 warning signs for Viva Energy Group you should be aware of.
If you're unsure about the strength of Viva Energy Group's business, why not explore our interactive list of stocks with solid business fundamentals for some other companies you may have missed.
New: Manage All Your Stock Portfolios in One Place
We've created the ultimate portfolio companion for stock investors, and it's free.
• Connect an unlimited number of Portfolios and see your total in one currency
• Be alerted to new Warning Signs or Risks via email or mobile
• Track the Fair Value of your stocks
Have feedback on this article? Concerned about the content? Get in touch with us directly. Alternatively, email editorial-team (at) simplywallst.com.
This article by Simply Wall St is general in nature. We provide commentary based on historical data and analyst forecasts only using an unbiased methodology and our articles are not intended to be financial advice. It does not constitute a recommendation to buy or sell any stock, and does not take account of your objectives, or your financial situation. We aim to bring you long-term focused analysis driven by fundamental data. Note that our analysis may not factor in the latest price-sensitive company announcements or qualitative material. Simply Wall St has no position in any stocks mentioned.
About ASX:VEA
Viva Energy Group
Operates as an energy company in Australia, Singapore, and Papua New Guinea.
Undervalued with reasonable growth potential.
Similar Companies
Market Insights
Community Narratives


