

Even when a business is losing money, it's possible for shareholders to make money if they buy a good business at the right price. For example, although Amazon.com made losses for many years after listing, if you had bought and held the shares since 1999, you would have made a fortune. But while history lauds those rare successes, those that fail are often forgotten; who remembers Pets.com?
So should TMK Energy (ASX:TMK) shareholders be worried about its cash burn? For the purpose of this article, we'll define cash burn as the amount of cash the company is spending each year to fund its growth (also called its negative free cash flow). First, we'll determine its cash runway by comparing its cash burn with its cash reserves.
Check out our latest analysis for TMK Energy
When Might TMK Energy Run Out Of Money?
A company's cash runway is the amount of time it would take to burn through its cash reserves at its current cash burn rate. When TMK Energy last reported its balance sheet in December 2022, it had zero debt and cash worth AU$2.7m. Importantly, its cash burn was AU$4.8m over the trailing twelve months. Therefore, from December 2022 it had roughly 7 months of cash runway. That's quite a short cash runway, indicating the company must either reduce its annual cash burn or replenish its cash. The image below shows how its cash balance has been changing over the last few years.
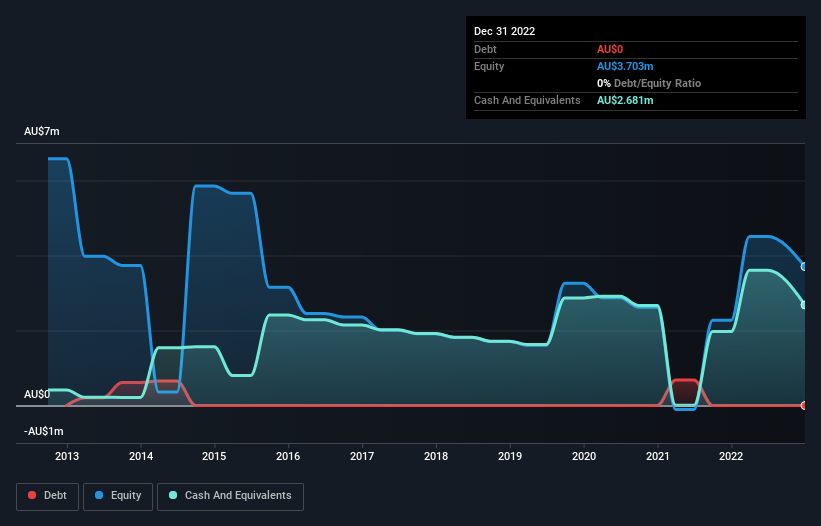
How Is TMK Energy's Cash Burn Changing Over Time?
Because TMK Energy isn't currently generating revenue, we consider it an early-stage business. So while we can't look to sales to understand growth, we can look at how the cash burn is changing to understand how expenditure is trending over time. Its cash burn positively exploded in the last year, up 555%. With that kind of spending growth its cash runway will shorten quickly, as it simultaneously uses its cash while increasing the burn rate. TMK Energy makes us a little nervous due to its lack of substantial operating revenue. We prefer most of the stocks on this list of stocks that analysts expect to grow.
How Hard Would It Be For TMK Energy To Raise More Cash For Growth?
Given its cash burn trajectory, TMK Energy shareholders should already be thinking about how easy it might be for it to raise further cash in the future. Issuing new shares, or taking on debt, are the most common ways for a listed company to raise more money for its business. One of the main advantages held by publicly listed companies is that they can sell shares to investors to raise cash and fund growth. By looking at a company's cash burn relative to its market capitalisation, we gain insight on how much shareholders would be diluted if the company needed to raise enough cash to cover another year's cash burn.
TMK Energy's cash burn of AU$4.8m is about 7.4% of its AU$65m market capitalisation. Given that is a rather small percentage, it would probably be really easy for the company to fund another year's growth by issuing some new shares to investors, or even by taking out a loan.
So, Should We Worry About TMK Energy's Cash Burn?
Even though its increasing cash burn makes us a little nervous, we are compelled to mention that we thought TMK Energy's cash burn relative to its market cap was relatively promising. Considering all the measures mentioned in this report, we reckon that its cash burn is fairly risky, and if we held shares we'd be watching like a hawk for any deterioration. On another note, TMK Energy has 6 warning signs (and 3 which are significant) we think you should know about.
If you would prefer to check out another company with better fundamentals, then do not miss this free list of interesting companies, that have HIGH return on equity and low debt or this list of stocks which are all forecast to grow.
Valuation is complex, but we're here to simplify it.
Discover if TMK Energy might be undervalued or overvalued with our detailed analysis, featuring fair value estimates, potential risks, dividends, insider trades, and its financial condition.
Access Free AnalysisHave feedback on this article? Concerned about the content? Get in touch with us directly. Alternatively, email editorial-team (at) simplywallst.com.
This article by Simply Wall St is general in nature. We provide commentary based on historical data and analyst forecasts only using an unbiased methodology and our articles are not intended to be financial advice. It does not constitute a recommendation to buy or sell any stock, and does not take account of your objectives, or your financial situation. We aim to bring you long-term focused analysis driven by fundamental data. Note that our analysis may not factor in the latest price-sensitive company announcements or qualitative material. Simply Wall St has no position in any stocks mentioned.
About ASX:TMK
TMK Energy
Engages in the exploration and appraisal of coal seam gas in Australia, Mongolia, and the United States.
Flawless balance sheet moderate.
Market Insights

Community Narratives


