

Howard Marks put it nicely when he said that, rather than worrying about share price volatility, 'The possibility of permanent loss is the risk I worry about... and every practical investor I know worries about.' It's only natural to consider a company's balance sheet when you examine how risky it is, since debt is often involved when a business collapses. We can see that NuEnergy Gas Limited (ASX:NGY) does use debt in its business. But the more important question is: how much risk is that debt creating?
Why Does Debt Bring Risk?
Debt assists a business until the business has trouble paying it off, either with new capital or with free cash flow. In the worst case scenario, a company can go bankrupt if it cannot pay its creditors. However, a more common (but still painful) scenario is that it has to raise new equity capital at a low price, thus permanently diluting shareholders. Of course, the upside of debt is that it often represents cheap capital, especially when it replaces dilution in a company with the ability to reinvest at high rates of return. The first thing to do when considering how much debt a business uses is to look at its cash and debt together.
View our latest analysis for NuEnergy Gas
What Is NuEnergy Gas's Debt?
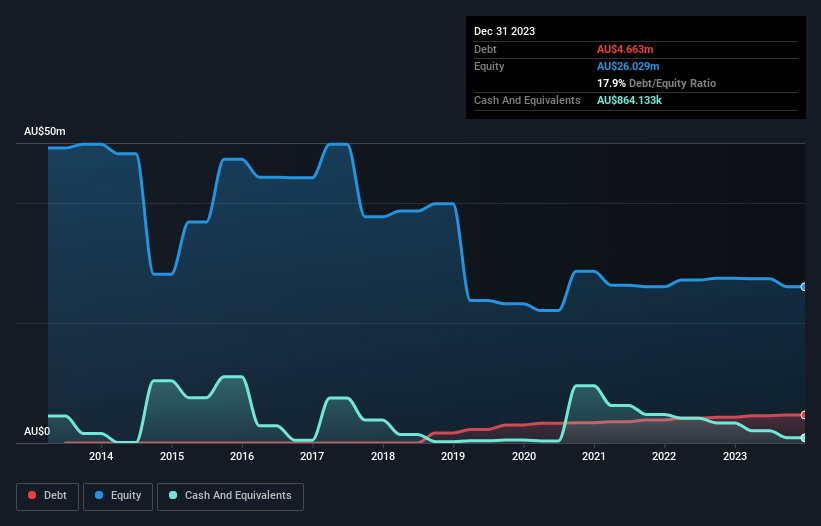
You can click the graphic below for the historical numbers, but it shows that as of December 2023 NuEnergy Gas had AU$4.66m of debt, an increase on AU$4.30m, over one year. However, because it has a cash reserve of AU$864.1k, its net debt is less, at about AU$3.80m.
How Healthy Is NuEnergy Gas' Balance Sheet?
According to the balance sheet data, NuEnergy Gas had liabilities of AU$15.8m due within 12 months, but no longer term liabilities. Offsetting these obligations, it had cash of AU$864.1k as well as receivables valued at AU$129.6k due within 12 months. So its liabilities total AU$14.8m more than the combination of its cash and short-term receivables.
While this might seem like a lot, it is not so bad since NuEnergy Gas has a market capitalization of AU$45.9m, and so it could probably strengthen its balance sheet by raising capital if it needed to. But we definitely want to keep our eyes open to indications that its debt is bringing too much risk. When analysing debt levels, the balance sheet is the obvious place to start. But it is NuEnergy Gas's earnings that will influence how the balance sheet holds up in the future. So when considering debt, it's definitely worth looking at the earnings trend. Click here for an interactive snapshot.
Since NuEnergy Gas doesn't have significant operating revenue, shareholders must hope it'll sell some fossil fuels, before it runs out of money.
Caveat Emptor
Over the last twelve months NuEnergy Gas produced an earnings before interest and tax (EBIT) loss. Indeed, it lost AU$488k at the EBIT level. Considering that alongside the liabilities mentioned above does not give us much confidence that company should be using so much debt. So we think its balance sheet is a little strained, though not beyond repair. However, it doesn't help that it burned through AU$2.2m of cash over the last year. So suffice it to say we do consider the stock to be risky. When analysing debt levels, the balance sheet is the obvious place to start. However, not all investment risk resides within the balance sheet - far from it. For example NuEnergy Gas has 3 warning signs (and 2 which don't sit too well with us) we think you should know about.
When all is said and done, sometimes its easier to focus on companies that don't even need debt. Readers can access a list of growth stocks with zero net debt 100% free, right now.
If you're looking to trade NuEnergy Gas, open an account with the lowest-cost platform trusted by professionals, Interactive Brokers.
With clients in over 200 countries and territories, and access to 160 markets, IBKR lets you trade stocks, options, futures, forex, bonds and funds from a single integrated account.
Enjoy no hidden fees, no account minimums, and FX conversion rates as low as 0.03%, far better than what most brokers offer.
Sponsored ContentValuation is complex, but we're here to simplify it.
Discover if NuEnergy Gas might be undervalued or overvalued with our detailed analysis, featuring fair value estimates, potential risks, dividends, insider trades, and its financial condition.
Access Free AnalysisHave feedback on this article? Concerned about the content? Get in touch with us directly. Alternatively, email editorial-team (at) simplywallst.com.
This article by Simply Wall St is general in nature. We provide commentary based on historical data and analyst forecasts only using an unbiased methodology and our articles are not intended to be financial advice. It does not constitute a recommendation to buy or sell any stock, and does not take account of your objectives, or your financial situation. We aim to bring you long-term focused analysis driven by fundamental data. Note that our analysis may not factor in the latest price-sensitive company announcements or qualitative material. Simply Wall St has no position in any stocks mentioned.
About ASX:NGY
NuEnergy Gas
An independent clean energy company, engages in the exploration, appraisal, and development of coal bed methane gas projects in Indonesia.
Adequate balance sheet slight.
Similar Companies
Market Insights

Community Narratives

