Advertisement
- Australia
- /
- Oil and Gas
- /
- ASX:HZN
3 ASX Penny Stocks With Market Caps Under A$500M

Simply Wall St
Reviewed by Simply Wall St
The Australian market has been experiencing a turbulent phase, with the ASX200 showing signs of unrest amid higher-than-expected inflation data and fluctuating commodity prices. In such conditions, investors often look for opportunities beyond the usual suspects, turning to penny stocks—smaller or newer companies that can offer unexpected potential. While the term "penny stocks" might seem outdated, these investments remain relevant for those seeking value in under-the-radar companies with strong financial health and growth prospects.
Top 10 Penny Stocks In Australia
| Name | Share Price | Market Cap | Rewards & Risks |
| Alfabs Australia (ASX:AAL) | A$0.49 | A$140.43M | ✅ 4 ⚠️ 3 View Analysis > |
| Dusk Group (ASX:DSK) | A$0.90 | A$56.04M | ✅ 4 ⚠️ 2 View Analysis > |
| IVE Group (ASX:IGL) | A$2.76 | A$424.18M | ✅ 4 ⚠️ 3 View Analysis > |
| MotorCycle Holdings (ASX:MTO) | A$3.78 | A$278.99M | ✅ 4 ⚠️ 2 View Analysis > |
| Pureprofile (ASX:PPL) | A$0.048 | A$56.15M | ✅ 3 ⚠️ 1 View Analysis > |
| Veris (ASX:VRS) | A$0.071 | A$37.4M | ✅ 4 ⚠️ 2 View Analysis > |
| West African Resources (ASX:WAF) | A$3.04 | A$3.47B | ✅ 4 ⚠️ 2 View Analysis > |
| Service Stream (ASX:SSM) | A$2.24 | A$1.37B | ✅ 3 ⚠️ 1 View Analysis > |
| Fleetwood (ASX:FWD) | A$2.95 | A$272.39M | ✅ 3 ⚠️ 2 View Analysis > |
| GWA Group (ASX:GWA) | A$2.47 | A$649.44M | ✅ 5 ⚠️ 1 View Analysis > |
Click here to see the full list of 419 stocks from our ASX Penny Stocks screener.
Here's a peek at a few of the choices from the screener.
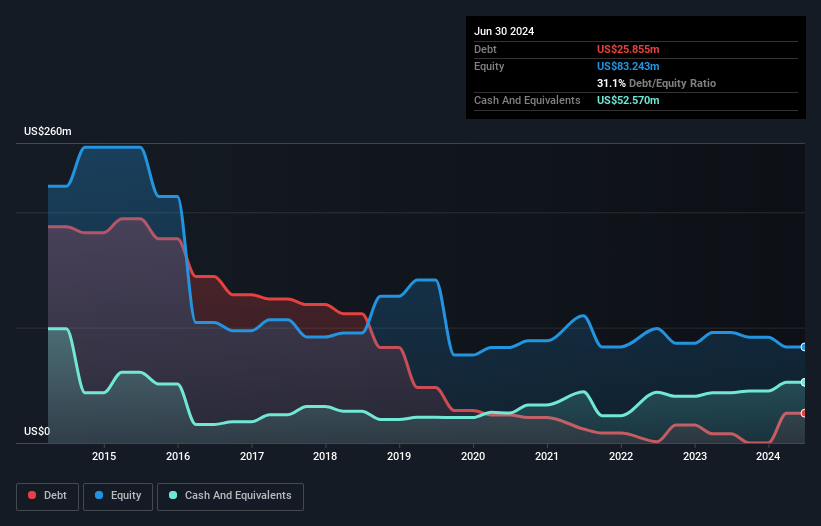
AMA Group (ASX:AMA)
Simply Wall St Financial Health Rating: ★★★★☆☆
Overview: AMA Group Limited operates a collision repair business across Australia and New Zealand, with a market cap of A$478.57 million.
Operations: The company's revenue segments include Ama Collision at A$360.04 million, Capital Smart at A$490.33 million, ACM Parts at A$99.70 million, Wales at A$77.88 million, and Specialist Businesses contributing A$56.29 million.
Market Cap: A$478.57M
AMA Group Limited, with a market cap of A$478.57 million, has reported annual sales of A$1.01 billion but remains unprofitable with a net loss of A$7.47 million for the year ending June 30, 2025. Despite its negative return on equity and inexperienced management team, AMA has managed to reduce its debt significantly over five years and maintains a satisfactory net debt to equity ratio of 7.2%. The company trades at a significant discount to estimated fair value and analysts expect stock price growth by 30%. It possesses sufficient cash runway for over three years despite ongoing losses.
- Jump into the full analysis health report here for a deeper understanding of AMA Group.
- Explore AMA Group's analyst forecasts in our growth report.
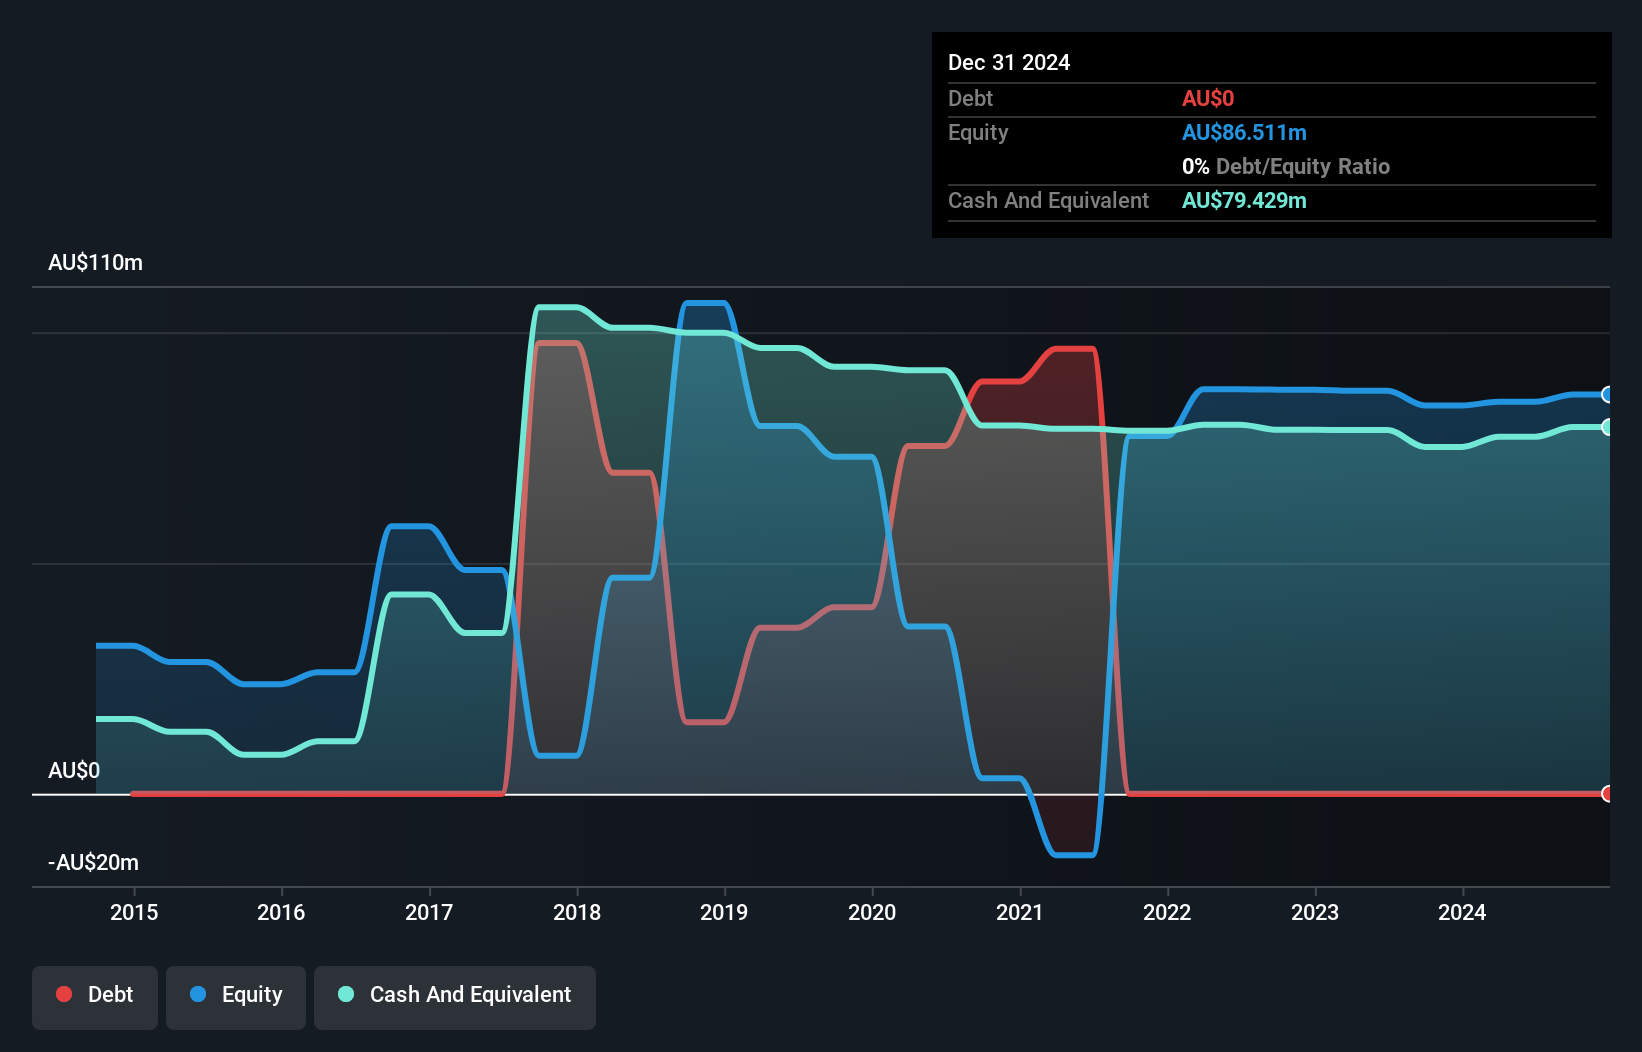
Berkeley Energia (ASX:BKY)
Simply Wall St Financial Health Rating: ★★★★★★
Overview: Berkeley Energia Limited is involved in the exploration and development of mineral properties in Spain, with a market capitalization of A$260.79 million.
Operations: There are no revenue segments reported for Berkeley Energia.
Market Cap: A$260.79M
Berkeley Energia Limited, with a market cap of A$260.79 million, is pre-revenue and focuses on critical minerals exploration in Spain. Recent positive metallurgical test results from the Conchas Project highlight potential recoveries of lithium and rubidium, essential for high-tech industries. Despite being unprofitable, Berkeley has no debt and maintains sufficient cash runway for over three years due to its strong short-term asset position of A$73.9 million against minimal liabilities. The seasoned management team supports strategic advancements in mineral exploration initiatives while the company's addition to the S&P/ASX All Ordinaries Index may enhance visibility among investors.
- Get an in-depth perspective on Berkeley Energia's performance by reading our balance sheet health report here.
- Examine Berkeley Energia's past performance report to understand how it has performed in prior years.
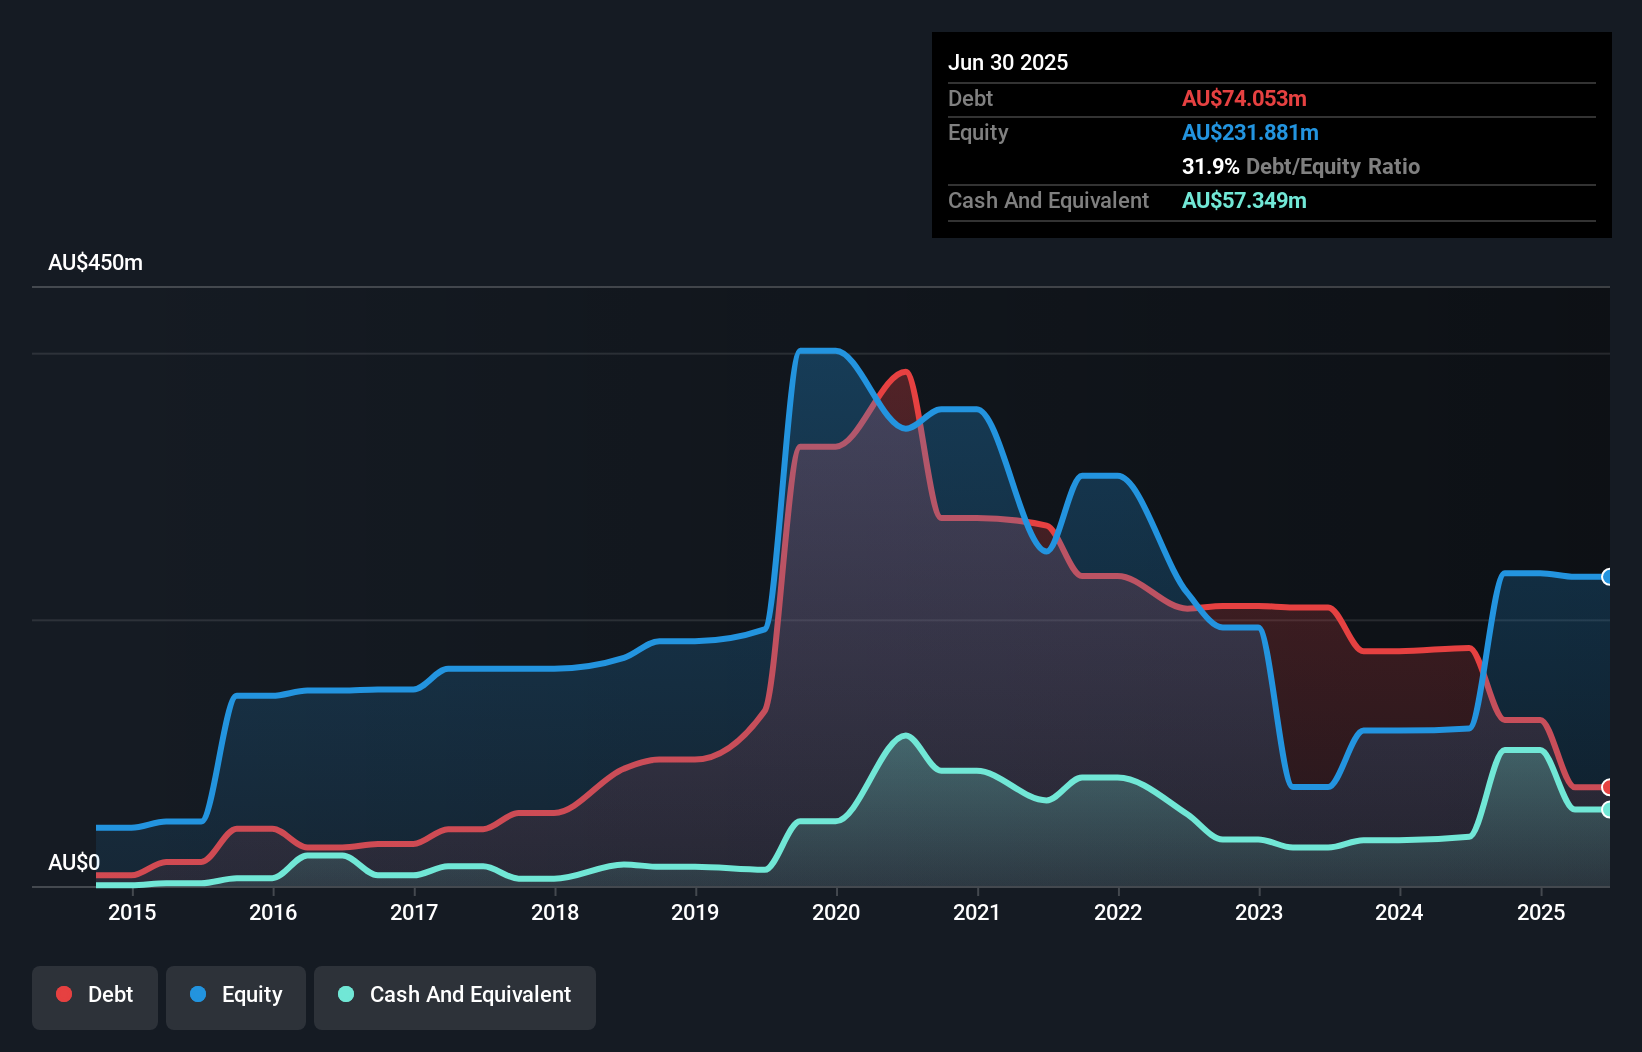
Horizon Oil (ASX:HZN)
Simply Wall St Financial Health Rating: ★★★★☆☆
Overview: Horizon Oil Limited, along with its subsidiaries, focuses on the exploration, development, and production of oil and gas properties in China, New Zealand, Australia, and Thailand with a market capitalization of A$333.66 million.
Operations: The company's revenue segments include Australia Development with $14.82 million, China Exploration and Development generating $47.59 million, and New Zealand Exploration and Development contributing $42.89 million.
Market Cap: A$333.66M
Horizon Oil Limited, with a market cap of A$333.66 million, has demonstrated financial stability by maintaining more cash than its total debt and covering short-term liabilities with assets of A$61.4 million against liabilities of A$26.6 million. However, the company's earnings have declined recently, with net income dropping to US$12.25 million from US$25.9 million last year and profit margins decreasing to 11.6%. Despite this downturn, Horizon's dividend yield remains high at 14.47%, though not fully supported by earnings or free cash flow, reflecting potential risk for dividend sustainability amidst industry challenges.
- Click to explore a detailed breakdown of our findings in Horizon Oil's financial health report.
- Understand Horizon Oil's track record by examining our performance history report.
Summing It All Up
- Reveal the 419 hidden gems among our ASX Penny Stocks screener with a single click here.
- Ready For A Different Approach? Uncover 11 companies that survived and thrived after COVID and have the right ingredients to survive Trump's tariffs.
This article by Simply Wall St is general in nature. We provide commentary based on historical data and analyst forecasts only using an unbiased methodology and our articles are not intended to be financial advice. It does not constitute a recommendation to buy or sell any stock, and does not take account of your objectives, or your financial situation. We aim to bring you long-term focused analysis driven by fundamental data. Note that our analysis may not factor in the latest price-sensitive company announcements or qualitative material. Simply Wall St has no position in any stocks mentioned.
Valuation is complex, but we're here to simplify it.
Discover if Horizon Oil might be undervalued or overvalued with our detailed analysis, featuring fair value estimates, potential risks, dividends, insider trades, and its financial condition.
Access Free AnalysisHave feedback on this article? Concerned about the content? Get in touch with us directly. Alternatively, email editorial-team@simplywallst.com
About ASX:HZN
Horizon Oil
Engages in the exploration, development, and production of oil and gas properties in China, New Zealand, Australia, and Thailand.
Adequate balance sheet with questionable track record.
Similar Companies
Market Insights

Advertisement
Community Narratives
The company that turned a verb into a global necessity and basically runs the modern internet, digital ads, smartphones, maps, and AI.
Fair Value US$300.00|8.5% undervalued
OS
Community Contributor
Flowers Foods Pays A Fair Price For Health
Fair Value US$16.12|24.6% undervalued
NV
Community Contributor
TMX Group will thrive with 33.3% profit margin and enduring market moat
Fair Value CA$49.90|0.1% undervalued
LI
Community Contributor