
Advertisement
- Australia
- /
- Oil and Gas
- /
- ASX:ERA
We're Keeping An Eye On Energy Resources of Australia's (ASX:ERA) Cash Burn Rate
We can readily understand why investors are attracted to unprofitable companies. For example, although Amazon.com made losses for many years after listing, if you had bought and held the shares since 1999, you would have made a fortune. But while history lauds those rare successes, those that fail are often forgotten; who remembers Pets.com?
So, the natural question for Energy Resources of Australia (ASX:ERA) shareholders is whether they should be concerned by its rate of cash burn. For the purposes of this article, cash burn is the annual rate at which an unprofitable company spends cash to fund its growth; its negative free cash flow. First, we'll determine its cash runway by comparing its cash burn with its cash reserves.
View our latest analysis for Energy Resources of Australia
How Long Is Energy Resources of Australia's Cash Runway?
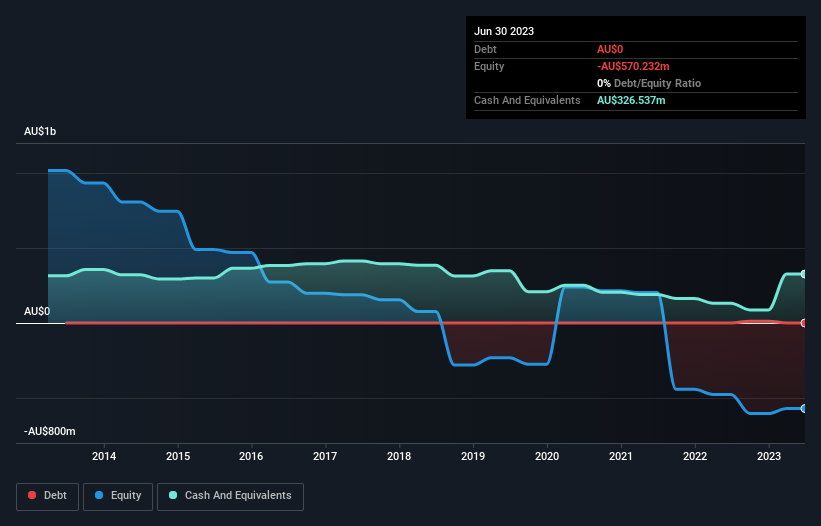
A company's cash runway is calculated by dividing its cash hoard by its cash burn. In June 2023, Energy Resources of Australia had AU$327m in cash, and was debt-free. Looking at the last year, the company burnt through AU$226m. That means it had a cash runway of around 17 months as of June 2023. That's not too bad, but it's fair to say the end of the cash runway is in sight, unless cash burn reduces drastically. Depicted below, you can see how its cash holdings have changed over time.
How Well Is Energy Resources of Australia Growing?
It was quite stunning to see that Energy Resources of Australia increased its cash burn by 282% over the last year. If that's not bad enough, it actually saw operating revenue decrease by a whopping 89% over the last year, suggesting the company is going through some sort of dangerous transition. Considering these two factors together makes us nervous about the direction the company seems to be heading. In reality, this article only makes a short study of the company's growth data. You can take a look at how Energy Resources of Australia has developed its business over time by checking this visualization of its revenue and earnings history.
How Easily Can Energy Resources of Australia Raise Cash?
Since Energy Resources of Australia can't yet boast improving growth metrics, the market will likely be considering how it can raise more cash if need be. Issuing new shares, or taking on debt, are the most common ways for a listed company to raise more money for its business. One of the main advantages held by publicly listed companies is that they can sell shares to investors to raise cash and fund growth. By comparing a company's annual cash burn to its total market capitalisation, we can estimate roughly how many shares it would have to issue in order to run the company for another year (at the same burn rate).
Since it has a market capitalisation of AU$1.3b, Energy Resources of Australia's AU$226m in cash burn equates to about 17% of its market value. As a result, we'd venture that the company could raise more cash for growth without much trouble, albeit at the cost of some dilution.
Is Energy Resources of Australia's Cash Burn A Worry?
On this analysis of Energy Resources of Australia's cash burn, we think its cash runway was reassuring, while its increasing cash burn has us a bit worried. After looking at that range of measures, we think shareholders should be extremely attentive to how the company is using its cash, as the cash burn makes us uncomfortable. On another note, Energy Resources of Australia has 5 warning signs (and 4 which are a bit concerning) we think you should know about.
If you would prefer to check out another company with better fundamentals, then do not miss this free list of interesting companies, that have HIGH return on equity and low debt or this list of stocks which are all forecast to grow.
Valuation is complex, but we're here to simplify it.
Discover if Energy Resources of Australia might be undervalued or overvalued with our detailed analysis, featuring fair value estimates, potential risks, dividends, insider trades, and its financial condition.
Access Free AnalysisHave feedback on this article? Concerned about the content? Get in touch with us directly. Alternatively, email editorial-team (at) simplywallst.com.
This article by Simply Wall St is general in nature. We provide commentary based on historical data and analyst forecasts only using an unbiased methodology and our articles are not intended to be financial advice. It does not constitute a recommendation to buy or sell any stock, and does not take account of your objectives, or your financial situation. We aim to bring you long-term focused analysis driven by fundamental data. Note that our analysis may not factor in the latest price-sensitive company announcements or qualitative material. Simply Wall St has no position in any stocks mentioned.
About ASX:ERA
Energy Resources of Australia
Engages in mine rehabilitation in Australia.
Slight risk with mediocre balance sheet.
Similar Companies
Market Insights

Advertisement
Community Narratives
The Next Phase of Energy Storage: How NeoVolta Is Tackling America’s Power Crunch
Fair Value US$7.50|35.1% undervalued
MA
Community Contributor
Why EnSilica is Worth Possibly 13x its Current Price
Fair Value UK£5.00|89.8% undervalued
DO
Community Contributor
M&A Activity, Industry Diversification & A Defense Contract Monopoly Will Push BWXT For Healthy Long-Term Growth
Fair Value US$220.00|15.2% undervalued
CL
Community Contributor
A case for Cassiar Gold Corp (TSXV: GLDC) to reach CAD$8-10 before 2030 (X30-37)
Fair Value CA$10.00|96.0% undervalued
AG
Community Contributor