
Advertisement
- Australia
- /
- Capital Markets
- /
- ASX:MQG
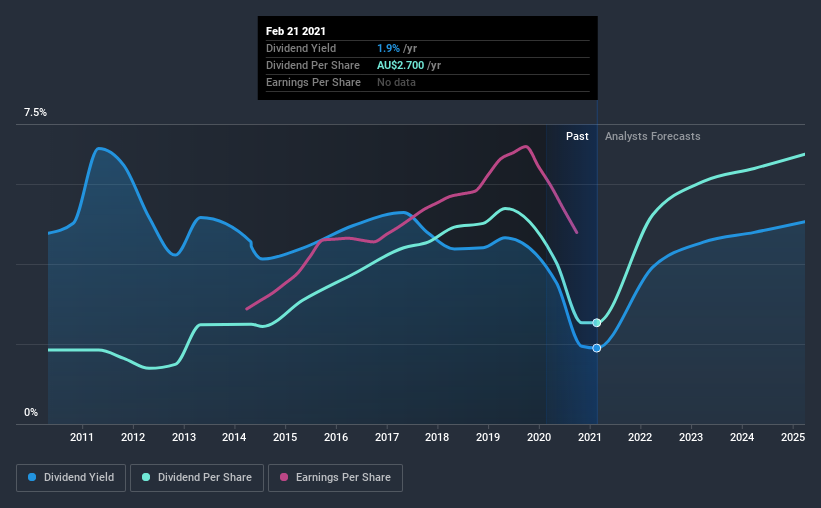
Macquarie Group Limited (ASX:MQG) Is Yielding 1.9% - But Is It A Buy?
Today we'll take a closer look at Macquarie Group Limited (ASX:MQG) from a dividend investor's perspective. Owning a strong business and reinvesting the dividends is widely seen as an attractive way of growing your wealth. Yet sometimes, investors buy a popular dividend stock because of its yield, and then lose money if the company's dividend doesn't live up to expectations.
A 1.9% yield is nothing to get excited about, but investors probably think the long payment history suggests Macquarie Group has some staying power. Before you buy any stock for its dividend however, you should always remember Warren Buffett's two rules: 1) Don't lose money, and 2) Remember rule #1. We'll run through some checks below to help with this.
Explore this interactive chart for our latest analysis on Macquarie Group!
Payout ratios
Dividends are usually paid out of company earnings. If a company is paying more than it earns, then the dividend might become unsustainable - hardly an ideal situation. As a result, we should always investigate whether a company can afford its dividend, measured as a percentage of a company's net income after tax. In the last year, Macquarie Group paid out 49% of its profit as dividends. This is a middling range that strikes a nice balance between paying dividends to shareholders, and retaining enough earnings to invest in future growth. Plus, there is room to increase the payout ratio over time.
We update our data on Macquarie Group every 24 hours, so you can always get our latest analysis of its financial health, here.
Dividend Volatility
One of the major risks of relying on dividend income, is the potential for a company to struggle financially and cut its dividend. Not only is your income cut, but the value of your investment declines as well - nasty. Macquarie Group has been paying dividends for a long time, but for the purpose of this analysis, we only examine the past 10 years of payments. Its dividend payments have declined on at least one occasion over the past 10 years. During the past 10-year period, the first annual payment was AU$2.0 in 2011, compared to AU$2.7 last year. Dividends per share have grown at approximately 3.2% per year over this time. Macquarie Group's dividend payments have fluctuated, so it hasn't grown 3.2% every year, but the CAGR is a useful rule of thumb for approximating the historical growth.
We're glad to see the dividend has risen, but with a limited rate of growth and fluctuations in the payments, we don't think this is an attractive combination.
Dividend Growth Potential
Given that the dividend has been cut in the past, we need to check if earnings are growing and if that might lead to stronger dividends in the future. While there may be fluctuations in the past , Macquarie Group's earnings per share have basically not grown from where they were five years ago. Over the long term, steady earnings per share is a risk as the value of the dividends can be reduced by inflation. A payout ratio below 50% leaves ample room to reinvest in the business, and provides finanical flexibility. However, earnings per share are unfortunately not growing much. Might this suggest that the company should pay a higher dividend instead?
Conclusion
Dividend investors should always want to know if a) a company's dividends are affordable, b) if there is a track record of consistent payments, and c) if the dividend is capable of growing. Firstly, we like that Macquarie Group has a low and conservative payout ratio. Second, earnings have been essentially flat, and its history of dividend payments is chequered - having cut its dividend at least once in the past. While we're not hugely bearish on it, overall we think there are potentially better dividend stocks than Macquarie Group out there.
Investors generally tend to favour companies with a consistent, stable dividend policy as opposed to those operating an irregular one. Still, investors need to consider a host of other factors, apart from dividend payments, when analysing a company. For instance, we've picked out 1 warning sign for Macquarie Group that investors should take into consideration.
We have also put together a list of global stocks with a market capitalisation above $1bn and yielding more 3%.
If you’re looking to trade Macquarie Group, open an account with the lowest-cost* platform trusted by professionals, Interactive Brokers. Their clients from over 200 countries and territories trade stocks, options, futures, forex, bonds and funds worldwide from a single integrated account. Promoted
New: Manage All Your Stock Portfolios in One Place
We've created the ultimate portfolio companion for stock investors, and it's free.
• Connect an unlimited number of Portfolios and see your total in one currency
• Be alerted to new Warning Signs or Risks via email or mobile
• Track the Fair Value of your stocks
This article by Simply Wall St is general in nature. It does not constitute a recommendation to buy or sell any stock, and does not take account of your objectives, or your financial situation. We aim to bring you long-term focused analysis driven by fundamental data. Note that our analysis may not factor in the latest price-sensitive company announcements or qualitative material. Simply Wall St has no position in any stocks mentioned.
*Interactive Brokers Rated Lowest Cost Broker by StockBrokers.com Annual Online Review 2020
Have feedback on this article? Concerned about the content? Get in touch with us directly. Alternatively, email editorial-team (at) simplywallst.com.
About ASX:MQG
Macquarie Group
Provides diversified financial services in Australia, New Zealand the Americas, Europe, the Middle East, Africa, and Asia.
Adequate balance sheet average dividend payer.
Similar Companies
Market Insights

Advertisement
Community Narratives
MicroVision will explode future revenue by 380.37% with a vision towards success
Fair Value US$60|98.4% undervalued
TH
Community Contributor
The Indispensable Artery for a New North American Economy
Fair Value CA$132.87|0.7% overvalued
TI
Community Contributor
Recently Updated Narratives
CO

composite32 on Astor Enerji ·
Astor Enerji will surge with a fair value of $140.43 in the next 3 years
Fair Value:₺140.4335.5% undervalued
1 followerusers have followed this narrative
0 commentsusers have commented on this narrative
0 likesusers have liked this narrative
RE

RecMag on Proximus ·
Proximus: The State-Backed Backup Plan with 7% Gross Yield and 15% Currency Upside.
Fair Value:€17.1356.7% undervalued
30 followersusers have followed this narrative
0 commentsusers have commented on this narrative
0 likesusers have liked this narrative
AG


Agricola on IMPACT Silver ·
A case for for IMPACT Silver Corp (TSXV:IPT) to reach USD $4.52 (CAD $6.16) in 2026 (23 bagger in 1 year) and USD $5.76 (CAD $7.89) by 2030
Fair Value:CA$7.8996.2% undervalued
1 followerusers have followed this narrative
0 commentsusers have commented on this narrative
0 likesusers have liked this narrative
Popular Narratives
TH

TheWallstreetKing on MicroVision ·
MicroVision will explode future revenue by 380.37% with a vision towards success
Fair Value:US$6098.4% undervalued
101 followersusers have followed this narrative
10 commentsusers have commented on this narrative
20 likesusers have liked this narrative
OS


oscargarcia on Alphabet ·
The company that turned a verb into a global necessity and basically runs the modern internet, digital ads, smartphones, maps, and AI.
Fair Value:US$3405.8% undervalued
137 followersusers have followed this narrative
6 commentsusers have commented on this narrative
18 likesusers have liked this narrative
AN


AnalystConsensusTarget on NVIDIA ·
NVDA: Expanding AI Demand Will Drive Major Data Center Investments Through 2026
Fair Value:US$250.3929.3% undervalued
929 followersusers have followed this narrative
6 commentsusers have commented on this narrative
23 likesusers have liked this narrative