Stock Analysis
- Australia
- /
- Metals and Mining
- /
- ASX:IGO
ASX Dividend Stocks: IGO And Two Others For Your Consideration

Reviewed by Simply Wall St

Over the past year, the Australian market has seen a modest increase of 6.2%, despite recent stagnation with a flat performance over the last week. In this context, stocks like IGO that offer dividends can be particularly appealing to investors looking for steady income in addition to potential market growth.
Top 10 Dividend Stocks In Australia
| Name | Dividend Yield | Dividend Rating |
| Lindsay Australia (ASX:LAU) | 6.67% | ★★★★★☆ |
| Fiducian Group (ASX:FID) | 3.96% | ★★★★★☆ |
| Nick Scali (ASX:NCK) | 4.97% | ★★★★★☆ |
| Centuria Capital Group (ASX:CNI) | 6.80% | ★★★★★☆ |
| Charter Hall Group (ASX:CHC) | 3.55% | ★★★★★☆ |
| Eagers Automotive (ASX:APE) | 7.01% | ★★★★★☆ |
| Premier Investments (ASX:PMV) | 4.60% | ★★★★★☆ |
| Fortescue (ASX:FMG) | 9.13% | ★★★★★☆ |
| Diversified United Investment (ASX:DUI) | 3.07% | ★★★★★☆ |
| Ricegrowers (ASX:SGLLV) | 7.76% | ★★★★☆☆ |
Click here to see the full list of 26 stocks from our Top ASX Dividend Stocks screener.
We're going to check out a few of the best picks from our screener tool.
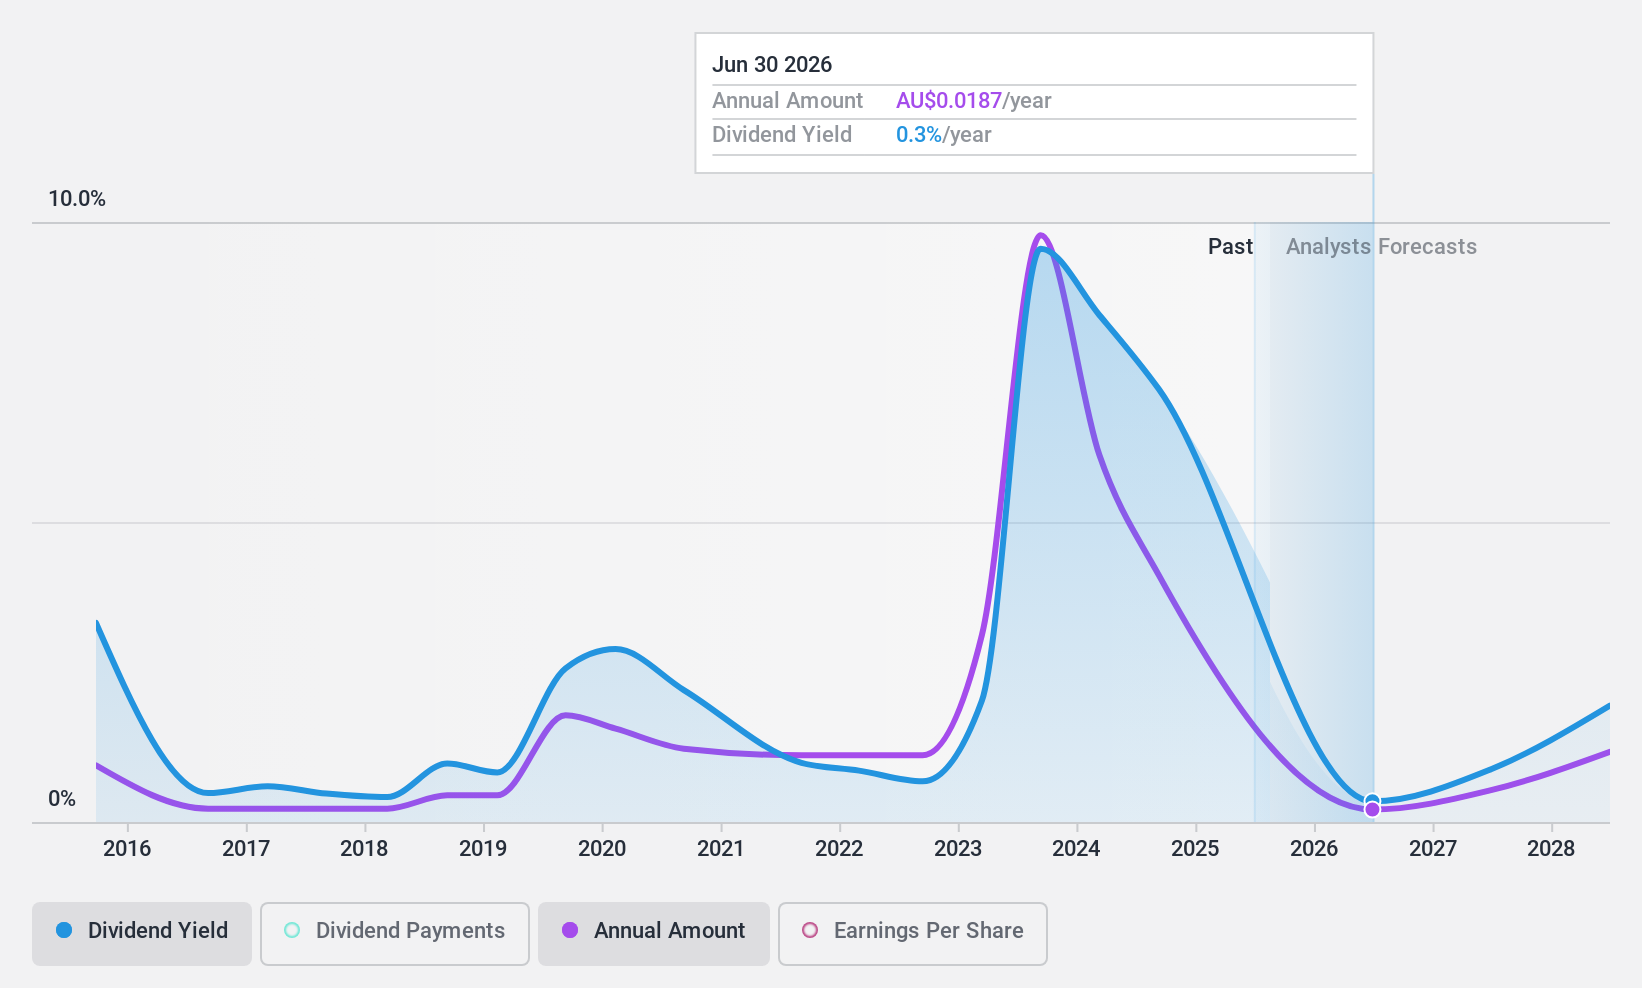
IGO (ASX:IGO)
Simply Wall St Dividend Rating: ★★★★☆☆
Overview: IGO Limited is an Australian exploration and mining company specializing in metals critical for clean energy, with a market capitalization of approximately A$4.53 billion.
Operations: IGO Limited generates revenue primarily from its Nova Operation and Forrestania Operation, totaling approximately A$903.40 million.
Dividend Yield: 9.2%
IGO offers a high dividend yield at 9.18%, placing it in the top 25% of Australian dividend payers. However, its dividends have shown volatility over the past decade and are currently not well covered by earnings, with a payout ratio of 185%. Despite this, dividends are reasonably supported by cash flows due to a lower cash payout ratio of 39.7%. Earnings are projected to grow by 23.05% annually, but recent one-off items and declining profit margins raise concerns about the sustainability and reliability of future dividends.
- Get an in-depth perspective on IGO's performance by reading our dividend report here.
- According our valuation report, there's an indication that IGO's share price might be on the cheaper side.
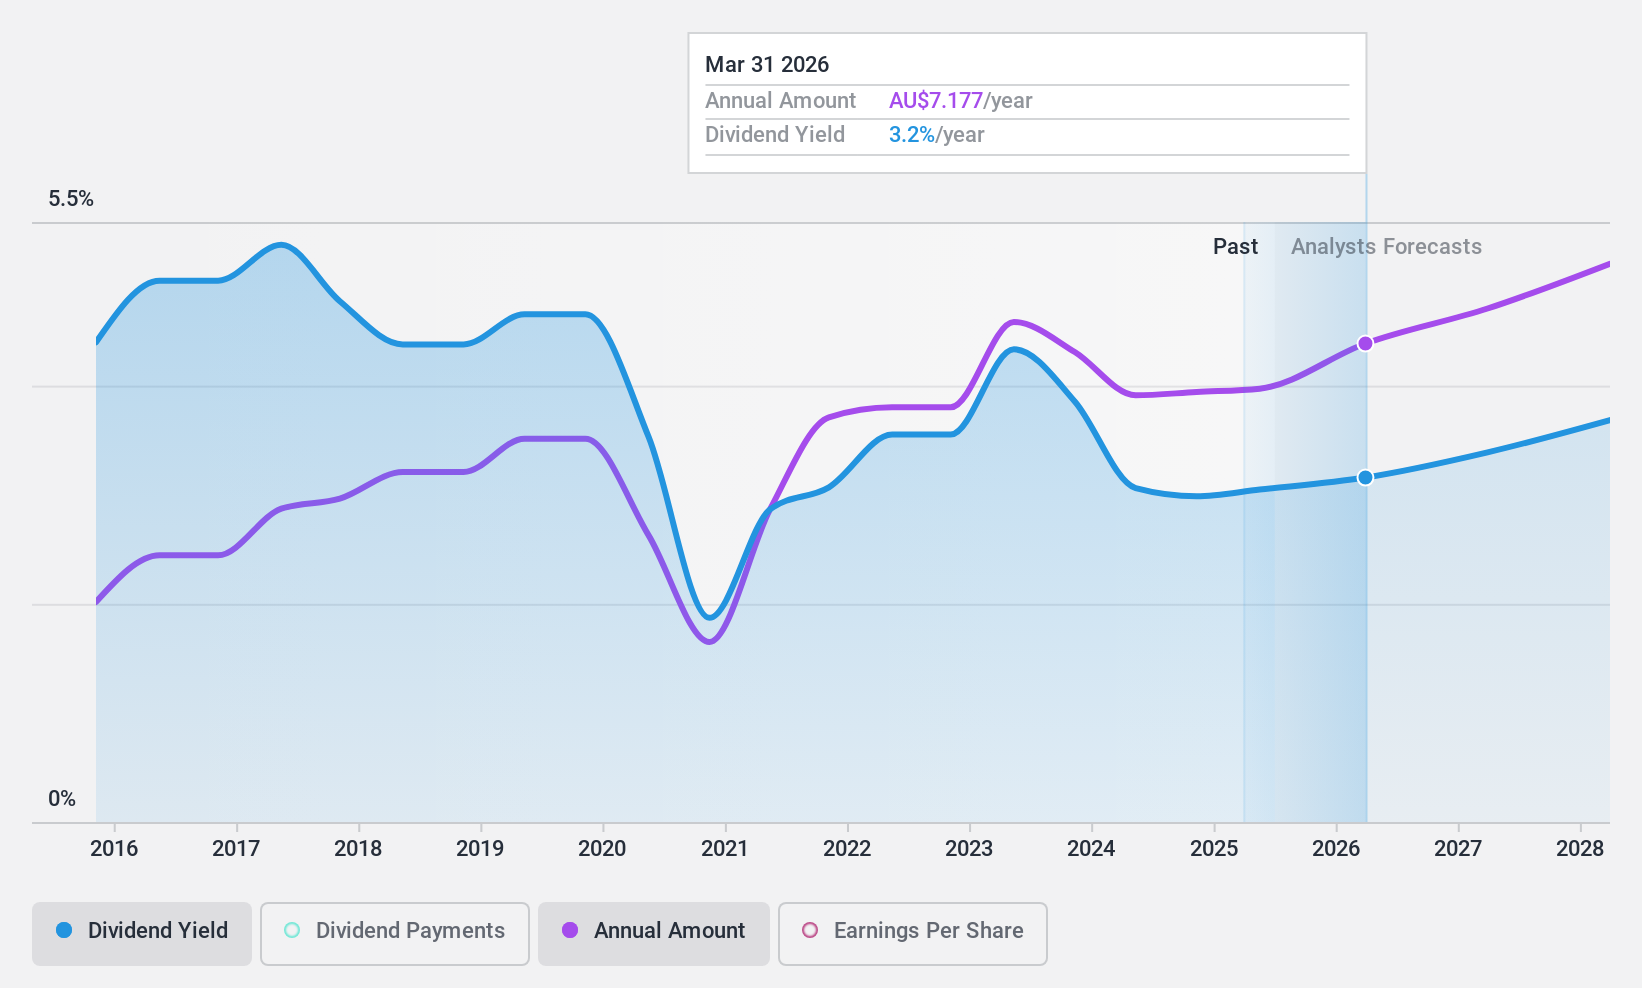
Macquarie Group (ASX:MQG)
Simply Wall St Dividend Rating: ★★★★☆☆
Overview: Macquarie Group Limited, operating globally, offers a range of financial services across sectors with a market capitalization of approximately A$72.20 billion.
Operations: Macquarie Group Limited generates revenue through various segments, including Macquarie Capital at A$2.61 billion, Macquarie Asset Management at A$3.75 billion, Banking and Financial Services at A$3.21 billion, and Commodities and Global Markets at A$6.32 billion.
Dividend Yield: 3.2%
Macquarie Group's dividend yield at 3.24% is modest compared to the market's top quartile, and its history of dividend payments has been inconsistent, with significant fluctuations over the past decade. Although its payout ratio of 69.8% suggests that dividends are currently supported by earnings, this coverage is expected to slightly improve in the next three years to a forecasted payout ratio of 63%. The company also maintains a low allowance for bad loans at 44%, indicating potential vulnerability in its loan portfolio.
- Click to explore a detailed breakdown of our findings in Macquarie Group's dividend report.
- According our valuation report, there's an indication that Macquarie Group's share price might be on the expensive side.
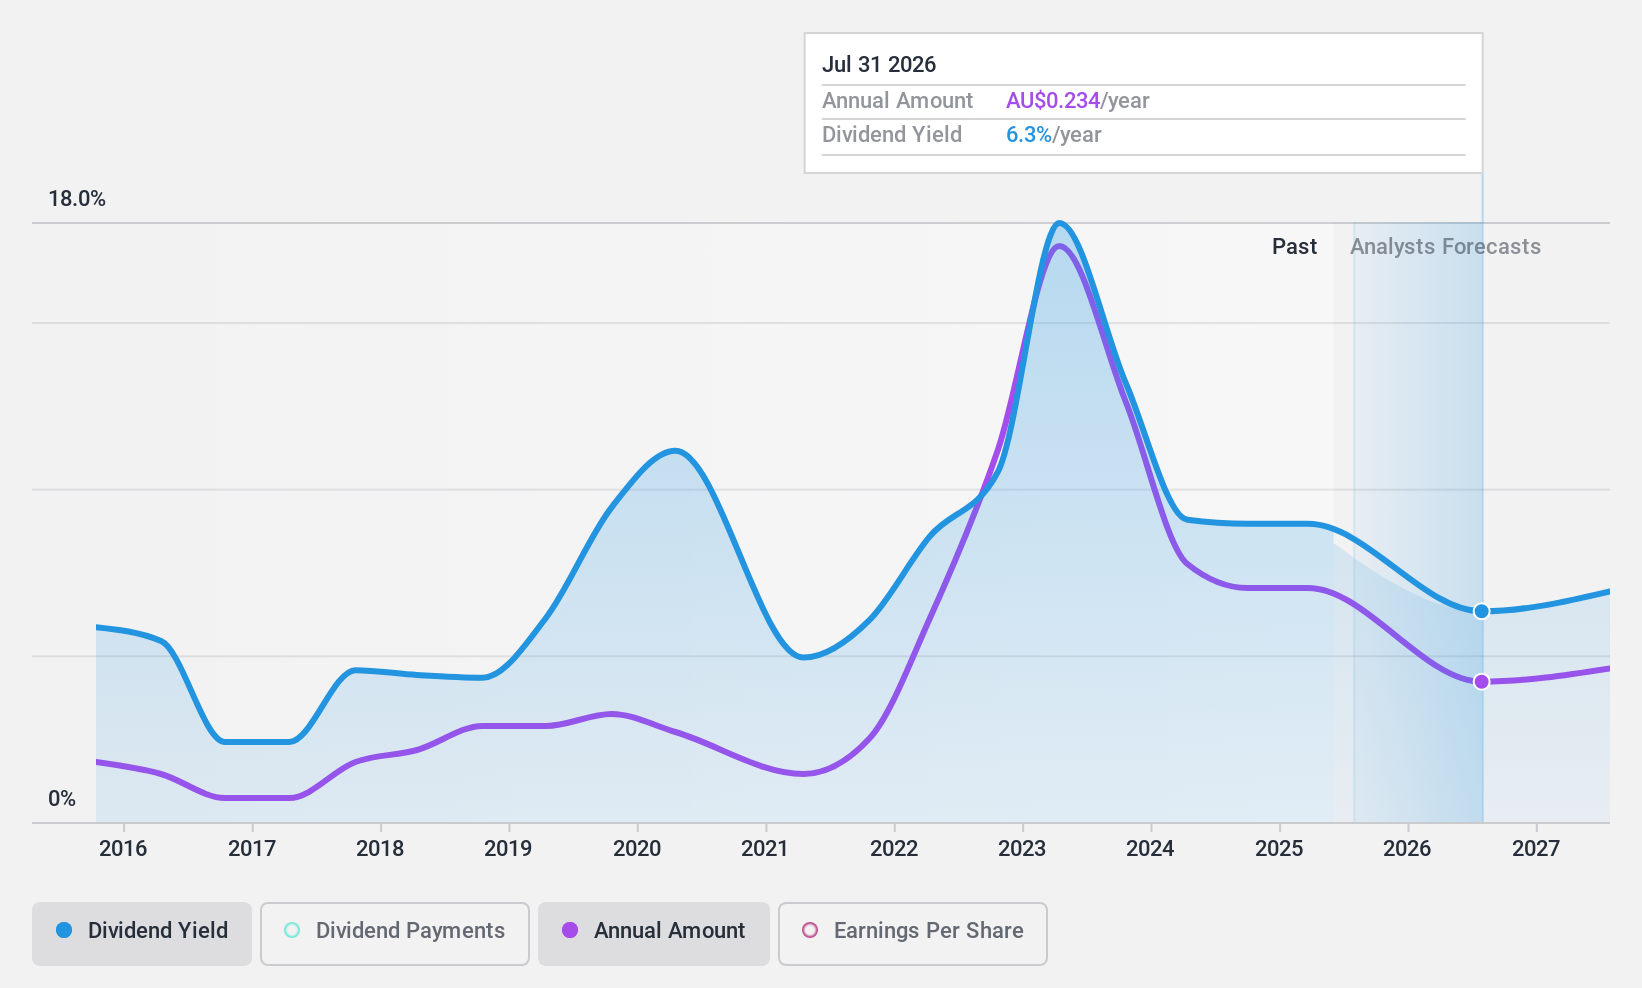
New Hope (ASX:NHC)
Simply Wall St Dividend Rating: ★★★★☆☆
Overview: New Hope Corporation Limited, with a market cap of A$3.93 billion, is engaged in the exploration, development, production, and processing of coal, as well as oil and gas properties.
Operations: New Hope Corporation Limited generates A$1.88 billion from its Coal Mining operations in New South Wales and an additional A$48.15 million from Coal Mining in Queensland, including Treasury and Investments.
Dividend Yield: 9.2%
New Hope's dividend yield of 9.25% ranks in the top 25% of Australian dividend payers, offering an attractive rate despite its challenges. The company trades at a significant 45% discount to estimated fair value and favorably compared to industry peers. However, its dividend sustainability is questionable; while the payout ratio stands at a moderate 48.4%, indicating earnings coverage, both earnings forecasts predict a decline and high cash payout ratio (90.2%) suggests dividends aren't well-supported by cash flows, reflecting potential risk in continuity and growth of payouts.
- Click here and access our complete dividend analysis report to understand the dynamics of New Hope.
- Insights from our recent valuation report point to the potential undervaluation of New Hope shares in the market.
Make It Happen
- Dive into all 26 of the Top ASX Dividend Stocks we have identified here.
- Have you diversified into these companies? Leverage the power of Simply Wall St's portfolio to keep a close eye on market movements affecting your investments.
- Streamline your investment strategy with Simply Wall St's app for free and benefit from extensive research on stocks across all corners of the world.
Searching for a Fresh Perspective?
- Explore high-performing small cap companies that haven't yet garnered significant analyst attention.
- Fuel your portfolio with companies showing strong growth potential, backed by optimistic outlooks both from analysts and management.
- Find companies with promising cash flow potential yet trading below their fair value.
This article by Simply Wall St is general in nature. We provide commentary based on historical data and analyst forecasts only using an unbiased methodology and our articles are not intended to be financial advice. It does not constitute a recommendation to buy or sell any stock, and does not take account of your objectives, or your financial situation. We aim to bring you long-term focused analysis driven by fundamental data. Note that our analysis may not factor in the latest price-sensitive company announcements or qualitative material. Simply Wall St has no position in any stocks mentioned.
Valuation is complex, but we're helping make it simple.
Find out whether IGO is potentially over or undervalued by checking out our comprehensive analysis, which includes fair value estimates, risks and warnings, dividends, insider transactions and financial health.
View the Free AnalysisHave feedback on this article? Concerned about the content? Get in touch with us directly. Alternatively, email editorial-team@simplywallst.com
About ASX:IGO
IGO
Operates as an exploration and mining company that engages in discovering, developing, and operating assets focused on metals to enable clean energy in Australia.
Flawless balance sheet, good value and pays a dividend.
