Advertisement
- Australia
- /
- Capital Markets
- /
- ASX:MQG
A Look at Macquarie Group's (ASX:MQG) Valuation After Half-Year Earnings Growth and Dividend Increase

Simply Wall St
Reviewed by Simply Wall St
Macquarie Group (ASX:MQG) delivered its half-year earnings update with gains in both net interest income and net profit, along with plans to lift its interim dividend. These developments are likely to shape investor perspectives.
See our latest analysis for Macquarie Group.
Despite reporting half-year growth in both net interest income and net profit, and announcing a higher interim dividend, Macquarie Group’s share price has lost some momentum, with a 1-month share price return of -12.4%. Over the longer run, its 3-year total shareholder return of 22.6% and 5-year total return of 72.8% highlight its resilient record and capacity for long-term value creation, even as recent performance softens.
If market shifts like this have you curious about broader opportunities, now is an ideal moment to broaden your search and discover fast growing stocks with high insider ownership
With shares trading below analyst targets and recent results showing ongoing growth, does this create a compelling entry point for investors, or is the market already factoring in Macquarie’s future earnings potential?
Most Popular Narrative: 10.6% Undervalued
With Macquarie Group’s fair value estimated at A$224.48, about 10.6% above its last close of A$200.58, the narrative points to potential upside if growth assumptions play out as forecast. This gap raises the stakes for the financial and strategic catalysts now shaping sentiment.
Macquarie Group is investing heavily in its asset management business, focusing on performance fees and fundraising, which should contribute to revenue growth and improve earnings as the market conditions align with these strategic moves.
Want to know the numbers behind this bold fair value call? The key to the narrative is explosive earnings and margin expansion combined with a premium future valuation multiple. Curious which headline assumptions power this upside? Dig into the next section to uncover the story behind the forecast.
Result: Fair Value of $224.48 (UNDERVALUED)
Have a read of the narrative in full and understand what's behind the forecasts.
However, shifts in foreign exchange rates or a slower than expected recovery in certain divisions could challenge Macquarie Group’s positive outlook.
Find out about the key risks to this Macquarie Group narrative.
Another View: Market Value Through Multiples
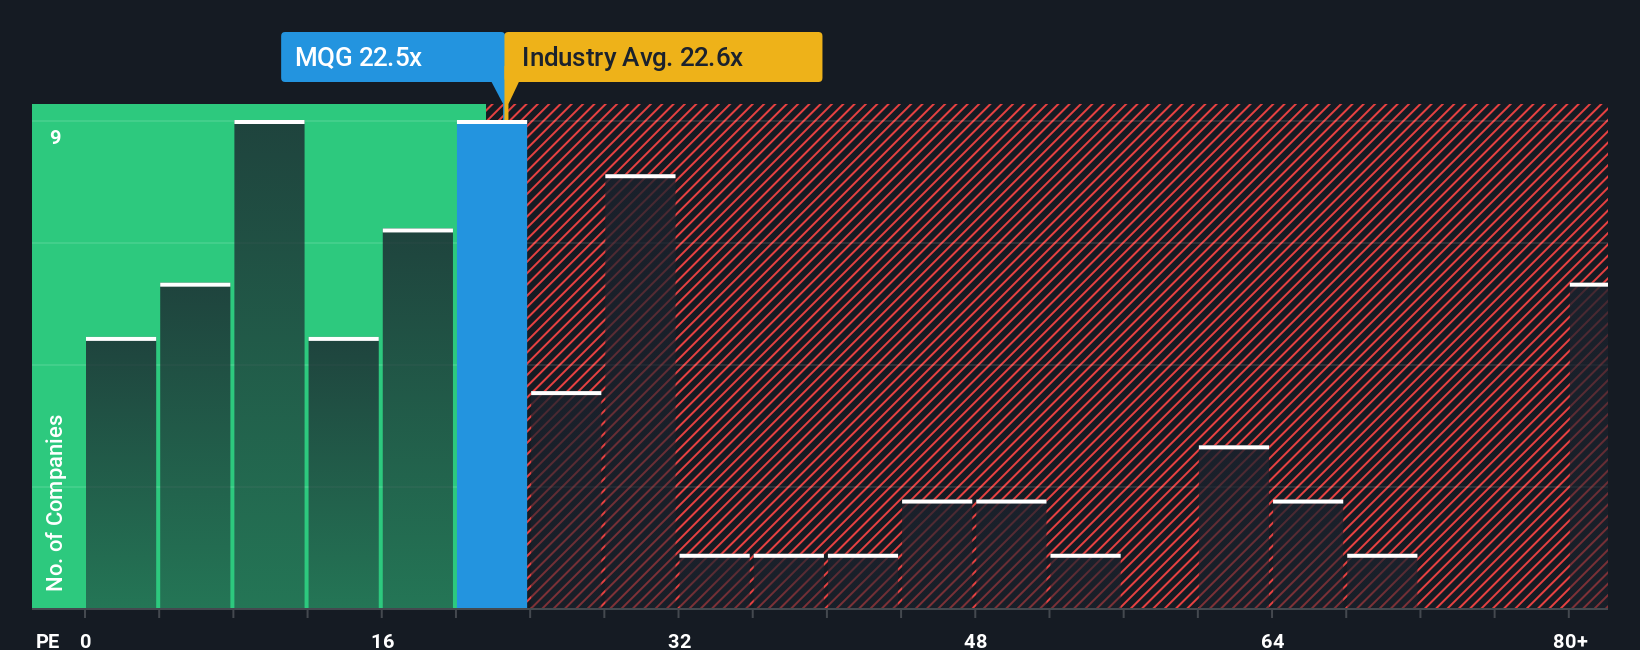
Looking at Macquarie Group’s price-to-earnings ratio of 20.2x, it sits below the peer average of 46.9x and also under the industry average of 22.6x. Compared to its fair ratio of 21.9x, this suggests the stock is attractively priced. However, could the market’s caution signal hidden risks or a potential value opportunity ahead?
See what the numbers say about this price — find out in our valuation breakdown.
Simply Wall St performs a discounted cash flow (DCF) on every stock in the world every day (check out Macquarie Group for example). We show the entire calculation in full. You can track the result in your watchlist or portfolio and be alerted when this changes, or use our stock screener to discover 878 undervalued stocks based on their cash flows. If you save a screener we even alert you when new companies match - so you never miss a potential opportunity.
Build Your Own Macquarie Group Narrative
If you see things differently or want a personalized perspective, it's faster than you think to build your own narrative and analysis from the data. Give your approach a try with Do it your way.
A great starting point for your Macquarie Group research is our analysis highlighting 4 key rewards and 3 important warning signs that could impact your investment decision.
Ready for More Smart Investment Moves?
Why limit your strategy to one opportunity? Stay ahead by finding new stocks that align with trends and strong fundamentals using the Simply Wall Street Screener.
- Seek robust yields and steady passive income potential by checking out these 16 dividend stocks with yields > 3% offering impressive returns above 3%.
- Tap into tomorrow's breakthroughs and fuel your portfolio with growth. Explore these 26 quantum computing stocks redefining the frontier of advanced computing.
- Capitalize on undervalued gems and stretch your investment dollar further with these 878 undervalued stocks based on cash flows based on reliable cash flow analysis.
This article by Simply Wall St is general in nature. We provide commentary based on historical data and analyst forecasts only using an unbiased methodology and our articles are not intended to be financial advice. It does not constitute a recommendation to buy or sell any stock, and does not take account of your objectives, or your financial situation. We aim to bring you long-term focused analysis driven by fundamental data. Note that our analysis may not factor in the latest price-sensitive company announcements or qualitative material. Simply Wall St has no position in any stocks mentioned.
New: Manage All Your Stock Portfolios in One Place
We've created the ultimate portfolio companion for stock investors, and it's free.
• Connect an unlimited number of Portfolios and see your total in one currency
• Be alerted to new Warning Signs or Risks via email or mobile
• Track the Fair Value of your stocks
Have feedback on this article? Concerned about the content? Get in touch with us directly. Alternatively, email editorial-team@simplywallst.com
About ASX:MQG
Macquarie Group
Provides diversified financial services in Australia, New Zealand the Americas, Europe, the Middle East, Africa, and Asia.
Adequate balance sheet average dividend payer.
Similar Companies
Market Insights

Advertisement
Community Narratives
MINISO's fair value is projected at 26.69 with an anticipated PE ratio shift of 20x
Fair Value US$24.03|11.0% undervalued
BE
Community Contributor
Procter & Gamble: A Dividend Giant Facing Slowing Growth
Fair Value US$119.81|23.3% overvalued
AN
Community Contributor
Eli Lilly's Future Growth Driven by Tirzepatide and Favorable Market Conditions
Fair Value US$1.19k|13.8% undervalued
EA
Community Contributor