- Australia
- /
- Consumer Finance
- /
- ASX:HUM
Three Things You Should Check Before Buying FlexiGroup Limited (ASX:FXL) For Its Dividend

Is FlexiGroup Limited (ASX:FXL) a good dividend stock? How can we tell? Dividend paying companies with growing earnings can be highly rewarding in the long term. If you are hoping to live on your dividends, it's important to be more stringent with your investments than the average punter. Regular readers know we like to apply the same approach to each dividend stock, and we hope you'll find our analysis useful.
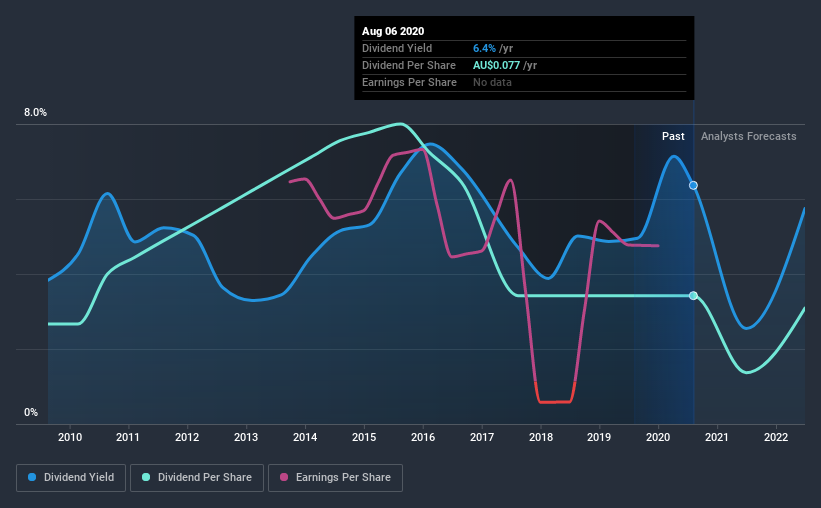
With FlexiGroup yielding 6.4% and having paid a dividend for over 10 years, many investors likely find the company quite interesting. We'd guess that plenty of investors have purchased it for the income. Before you buy any stock for its dividend however, you should always remember Warren Buffett's two rules: 1) Don't lose money, and 2) Remember rule #1. We'll run through some checks below to help with this.
Click the interactive chart for our full dividend analysis

Payout ratios
Companies (usually) pay dividends out of their earnings. If a company is paying more than it earns, the dividend might have to be cut. So we need to form a view on if a company's dividend is sustainable, relative to its net profit after tax. FlexiGroup paid out 49% of its profit as dividends, over the trailing twelve month period. This is a medium payout level that leaves enough capital in the business to fund opportunities that might arise, while also rewarding shareholders. One of the risks is that management reinvests the retained capital poorly instead of paying a higher dividend.
Consider getting our latest analysis on FlexiGroup's financial position here.
Dividend Volatility
One of the major risks of relying on dividend income, is the potential for a company to struggle financially and cut its dividend. Not only is your income cut, but the value of your investment declines as well - nasty. For the purpose of this article, we only scrutinise the last decade of FlexiGroup's dividend payments. Its dividend payments have declined on at least one occasion over the past 10 years. During the past 10-year period, the first annual payment was AU$0.06 in 2010, compared to AU$0.08 last year. Dividends per share have grown at approximately 2.5% per year over this time. The growth in dividends has not been linear, but the CAGR is a decent approximation of the rate of change over this time frame.
We're glad to see the dividend has risen, but with a limited rate of growth and fluctuations in the payments, we don't think this is an attractive combination.
Dividend Growth Potential
With a relatively unstable dividend, it's even more important to see if earnings per share (EPS) are growing. Why take the risk of a dividend getting cut, unless there's a good chance of bigger dividends in future? In the last five years, FlexiGroup's earnings per share have shrunk at approximately 3.6% per annum. If earnings continue to decline, the dividend may come under pressure. Every investor should make an assessment of whether the company is taking steps to stabilise the situation.
We'd also point out that FlexiGroup issued a meaningful number of new shares in the past year. Regularly issuing new shares can be detrimental - it's hard to grow dividends per share when new shares are regularly being created.
Conclusion
When we look at a dividend stock, we need to form a judgement on whether the dividend will grow, if the company is able to maintain it in a wide range of economic circumstances, and if the dividend payout is sustainable. Firstly, we like that FlexiGroup has a low and conservative payout ratio. Second, earnings per share have been in decline, and its dividend has been cut at least once in the past. FlexiGroup might not be a bad business, but it doesn't show all of the characteristics we look for in a dividend stock.
Investors generally tend to favour companies with a consistent, stable dividend policy as opposed to those operating an irregular one. However, there are other things to consider for investors when analysing stock performance. Just as an example, we've come accross 3 warning signs for FlexiGroup you should be aware of, and 1 of them is a bit concerning.
We have also put together a list of global stocks with a market capitalisation above $1bn and yielding more 3%.
When trading FlexiGroup or any other investment, use the platform considered by many to be the Professional's Gateway to the Worlds Market, Interactive Brokers. You get the lowest-cost* trading on stocks, options, futures, forex, bonds and funds worldwide from a single integrated account. Promoted
Valuation is complex, but we're here to simplify it.
Discover if Humm Group might be undervalued or overvalued with our detailed analysis, featuring fair value estimates, potential risks, dividends, insider trades, and its financial condition.
Access Free AnalysisThis article by Simply Wall St is general in nature. It does not constitute a recommendation to buy or sell any stock, and does not take account of your objectives, or your financial situation. We aim to bring you long-term focused analysis driven by fundamental data. Note that our analysis may not factor in the latest price-sensitive company announcements or qualitative material. Simply Wall St has no position in any stocks mentioned.
*Interactive Brokers Rated Lowest Cost Broker by StockBrokers.com Annual Online Review 2020
Have feedback on this article? Concerned about the content? Get in touch with us directly. Alternatively, email editorial-team@simplywallst.com.
About ASX:HUM
Humm Group
Provides various financial products and services in Australia, New Zealand, Ireland, the United Kingdom, and Canada.
High growth potential and fair value.
Similar Companies
Market Insights
Community Narratives


