Advertisement
- Australia
- /
- Metals and Mining
- /
- ASX:HAV
ASX Penny Stocks To Watch In February 2025

Simply Wall St
Reviewed by Simply Wall St
The Australian market is experiencing a cautious start, with ASX 200 futures indicating a slight decline amid mixed signals from global markets and economic data releases. Despite the volatility, penny stocks continue to capture investor interest due to their potential for significant growth at lower price points. These smaller or newer companies may offer unique opportunities when supported by strong financials, making them an intriguing area for exploration in today's market landscape.
Top 10 Penny Stocks In Australia
| Name | Share Price | Market Cap | Financial Health Rating |
| Embark Early Education (ASX:EVO) | A$0.80 | A$146.79M | ★★★★☆☆ |
| LaserBond (ASX:LBL) | A$0.58 | A$68.05M | ★★★★★★ |
| EZZ Life Science Holdings (ASX:EZZ) | A$1.95 | A$91.99M | ★★★★★★ |
| Austin Engineering (ASX:ANG) | A$0.47 | A$291.47M | ★★★★★☆ |
| IVE Group (ASX:IGL) | A$2.21 | A$342.3M | ★★★★☆☆ |
| Helloworld Travel (ASX:HLO) | A$2.04 | A$332.15M | ★★★★★★ |
| Dusk Group (ASX:DSK) | A$1.05 | A$65.38M | ★★★★★★ |
| GTN (ASX:GTN) | A$0.525 | A$103.1M | ★★★★★★ |
| MaxiPARTS (ASX:MXI) | A$1.78 | A$98.46M | ★★★★★★ |
| Vita Life Sciences (ASX:VLS) | A$1.78 | A$99.04M | ★★★★★★ |
Click here to see the full list of 1,032 stocks from our ASX Penny Stocks screener.
Let's review some notable picks from our screened stocks.
Bell Financial Group (ASX:BFG)
Simply Wall St Financial Health Rating: ★★★★☆☆
Overview: Bell Financial Group Limited provides full-service and online broking, corporate finance, and financial advisory services to a diverse client base across Australia, the United States, the United Kingdom, Hong Kong, and Kuala Lumpur with a market cap of A$439.42 million.
Operations: The company's revenue is derived from three main segments: Broking (A$173.47 million), Products & Services (A$51.01 million), and Technology & Platforms (A$29.89 million).
Market Cap: A$439.42M
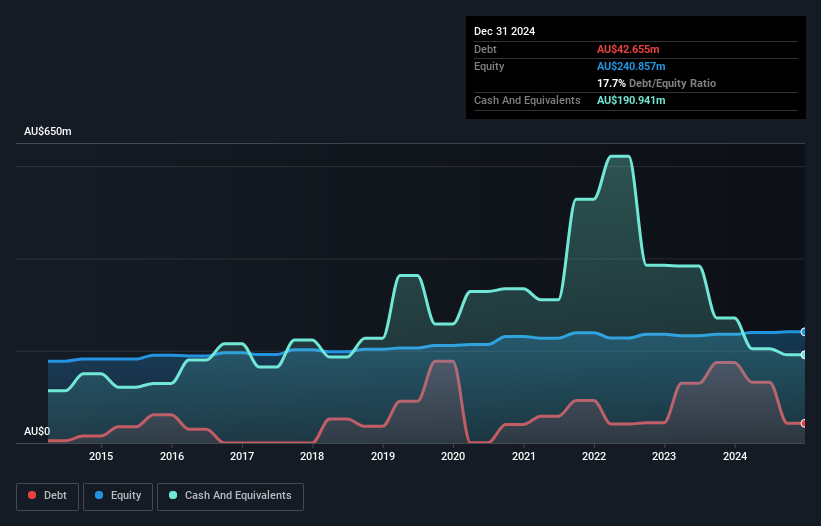
Bell Financial Group has shown a significant improvement in earnings, growing by 26.4% over the past year, surpassing its five-year average decline of 8.6%. The company recently declared a dividend of A$0.04 per share and reported full-year revenue of A$276.38 million with a net income increase to A$30.74 million for 2024. Despite trading below its estimated fair value, Bell Financial's dividend is not well-covered by free cash flows, and operating cash flow remains negative, indicating potential liquidity concerns despite having more cash than total debt and reduced debt-to-equity ratio from 83.9% to 17.7%.
- Dive into the specifics of Bell Financial Group here with our thorough balance sheet health report.
- Review our growth performance report to gain insights into Bell Financial Group's future.
Havilah Resources (ASX:HAV)
Simply Wall St Financial Health Rating: ★★★★★★
Overview: Havilah Resources Limited, with a market cap of A$74.64 million, is involved in the exploration and evaluation of mineral resource properties in Australia through its subsidiaries.
Operations: The company's revenue segment is derived entirely from the exploration for and evaluation of mineral resources, amounting to A$0.01 million.
Market Cap: A$74.64M
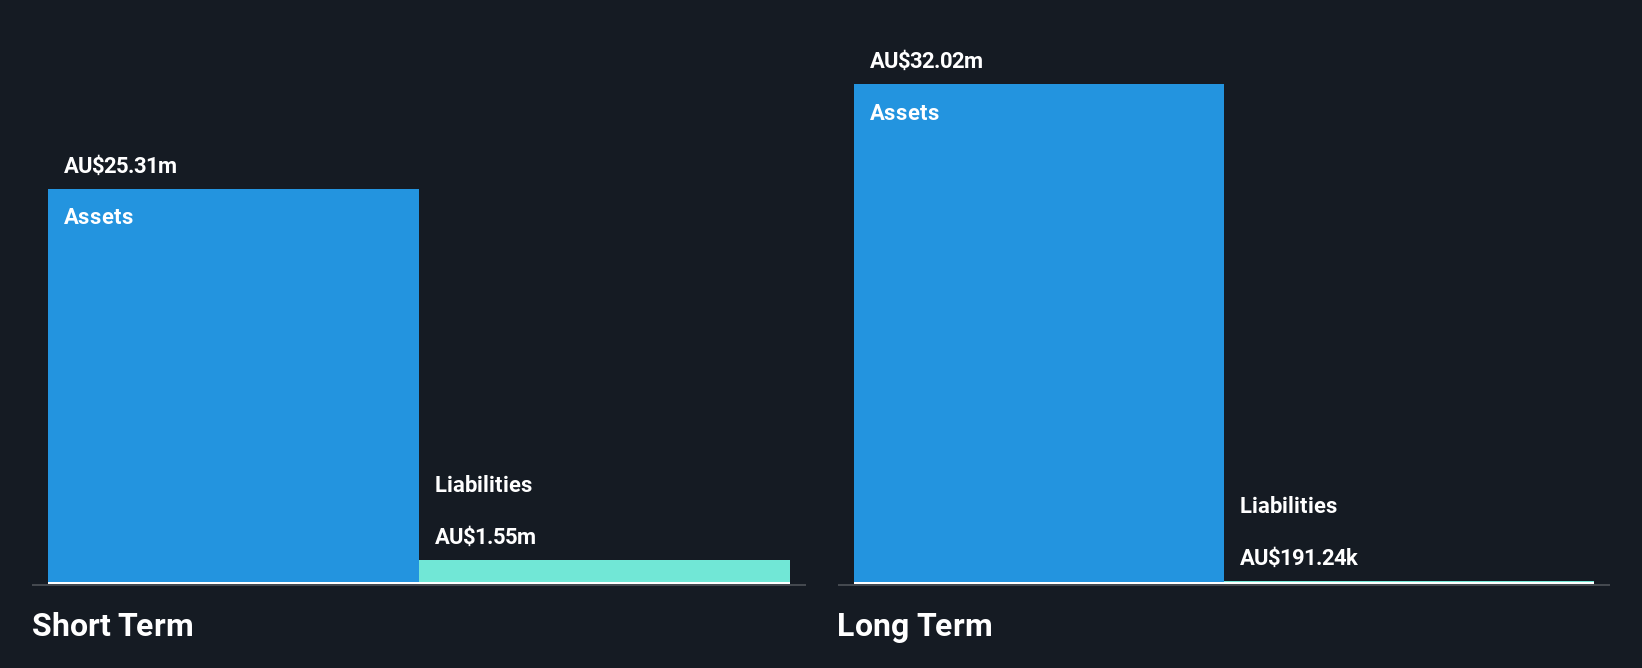
Havilah Resources, with a market cap of A$74.64 million, is pre-revenue, generating only A$0.01 million from its mineral exploration activities. Despite this, the company has demonstrated robust earnings growth of 90.2% over the past year and has become profitable over five years with a 66.3% annual increase in earnings. It benefits from being debt-free and having short-term assets (A$23.4M) that cover both short-term (A$1.5M) and long-term liabilities (A$171.3K). The management team and board are experienced, contributing to stable weekly volatility at 7%, though the Return on Equity remains low at 10.7%.
- Click to explore a detailed breakdown of our findings in Havilah Resources' financial health report.
- Explore historical data to track Havilah Resources' performance over time in our past results report.
NobleOak Life (ASX:NOL)
Simply Wall St Financial Health Rating: ★★★★★★
Overview: NobleOak Life Limited, with a market cap of A$137.99 million, manufactures and distributes life insurance products in Australia.
Operations: The company's revenue is derived from three segments: Genus (A$14.98 million), Direct (A$86.65 million), and Strategic Partnerships (A$275.19 million).
Market Cap: A$138M
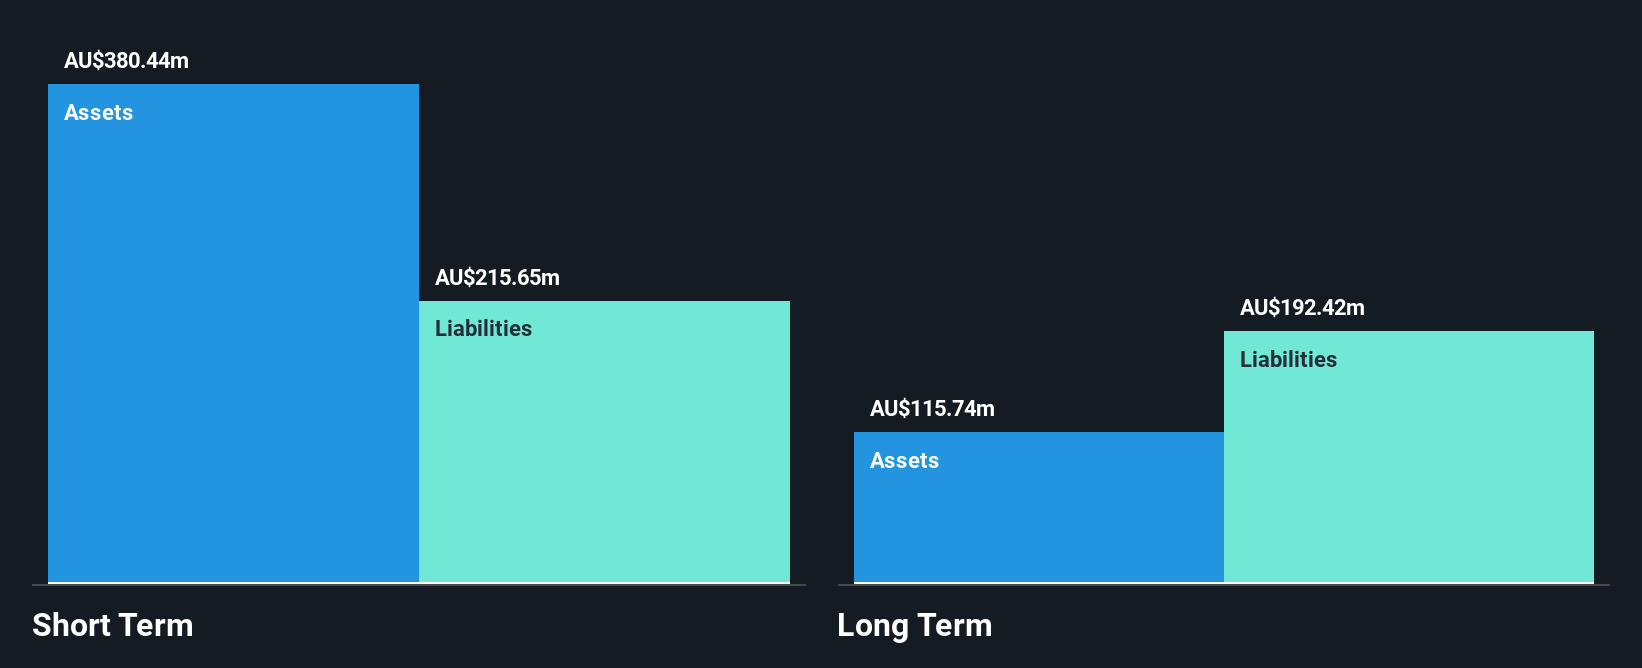
NobleOak Life Limited, with a market cap of A$137.99 million, is characterized by stable weekly volatility at 5% and a seasoned board with an average tenure of 4.9 years. Despite experiencing negative earnings growth over the past year, it maintains high-quality earnings and no debt burden, ensuring financial stability with short-term assets (A$318.8M) covering both short-term (A$212.7M) and long-term liabilities (A$179.7M). The company is undergoing leadership changes as Sarah Brennan takes over as Chair from Stephen Harrison in 2025, potentially influencing its strategic direction in the competitive insurance sector.
- Take a closer look at NobleOak Life's potential here in our financial health report.
- Examine NobleOak Life's earnings growth report to understand how analysts expect it to perform.
Seize The Opportunity
- Unlock more gems! Our ASX Penny Stocks screener has unearthed 1,029 more companies for you to explore.Click here to unveil our expertly curated list of 1,032 ASX Penny Stocks.
- Are you invested in these stocks already? Keep abreast of every twist and turn by setting up a portfolio with Simply Wall St, where we make it simple for investors like you to stay informed and proactive.
- Simply Wall St is your key to unlocking global market trends, a free user-friendly app for forward-thinking investors.
Seeking Other Investments?
- Explore high-performing small cap companies that haven't yet garnered significant analyst attention.
- Jump on the AI train with fast growing tech companies forging a new era of innovation.
- Find companies with promising cash flow potential yet trading below their fair value.
This article by Simply Wall St is general in nature. We provide commentary based on historical data and analyst forecasts only using an unbiased methodology and our articles are not intended to be financial advice. It does not constitute a recommendation to buy or sell any stock, and does not take account of your objectives, or your financial situation. We aim to bring you long-term focused analysis driven by fundamental data. Note that our analysis may not factor in the latest price-sensitive company announcements or qualitative material. Simply Wall St has no position in any stocks mentioned.
Valuation is complex, but we're here to simplify it.
Discover if Havilah Resources might be undervalued or overvalued with our detailed analysis, featuring fair value estimates, potential risks, dividends, insider trades, and its financial condition.
Access Free AnalysisHave feedback on this article? Concerned about the content? Get in touch with us directly. Alternatively, email editorial-team@simplywallst.com
About ASX:HAV
Havilah Resources
Engages in the exploration and evaluation of mineral resource properties in Australia.
Flawless balance sheet with low risk.
Market Insights


Advertisement
Community Narratives
100% Patient Improvement in trial puts this $16M Biotech on the radar
Fair Value US$5.30|74.9% undervalued
JO
Community Contributor
PayPal's Future Growth Through Venmo and Merchant Solutions
Fair Value US$105.25|35.1% undervalued
ZW
Community Contributor
IREN's Bold Moves in Sustainable Bitcoin Mining & AI Data Centers
Fair Value US$26.54|1.5% undervalued
BL
Community Contributor