
Advertisement
Some say volatility, rather than debt, is the best way to think about risk as an investor, but Warren Buffett famously said that 'Volatility is far from synonymous with risk.' When we think about how risky a company is, we always like to look at its use of debt, since debt overload can lead to ruin. We note that xReality Group Limited (ASX:XRG) does have debt on its balance sheet. But the more important question is: how much risk is that debt creating?
When Is Debt A Problem?
Debt and other liabilities become risky for a business when it cannot easily fulfill those obligations, either with free cash flow or by raising capital at an attractive price. In the worst case scenario, a company can go bankrupt if it cannot pay its creditors. However, a more common (but still painful) scenario is that it has to raise new equity capital at a low price, thus permanently diluting shareholders. Of course, the upside of debt is that it often represents cheap capital, especially when it replaces dilution in a company with the ability to reinvest at high rates of return. When we think about a company's use of debt, we first look at cash and debt together.
What Is xReality Group's Debt?
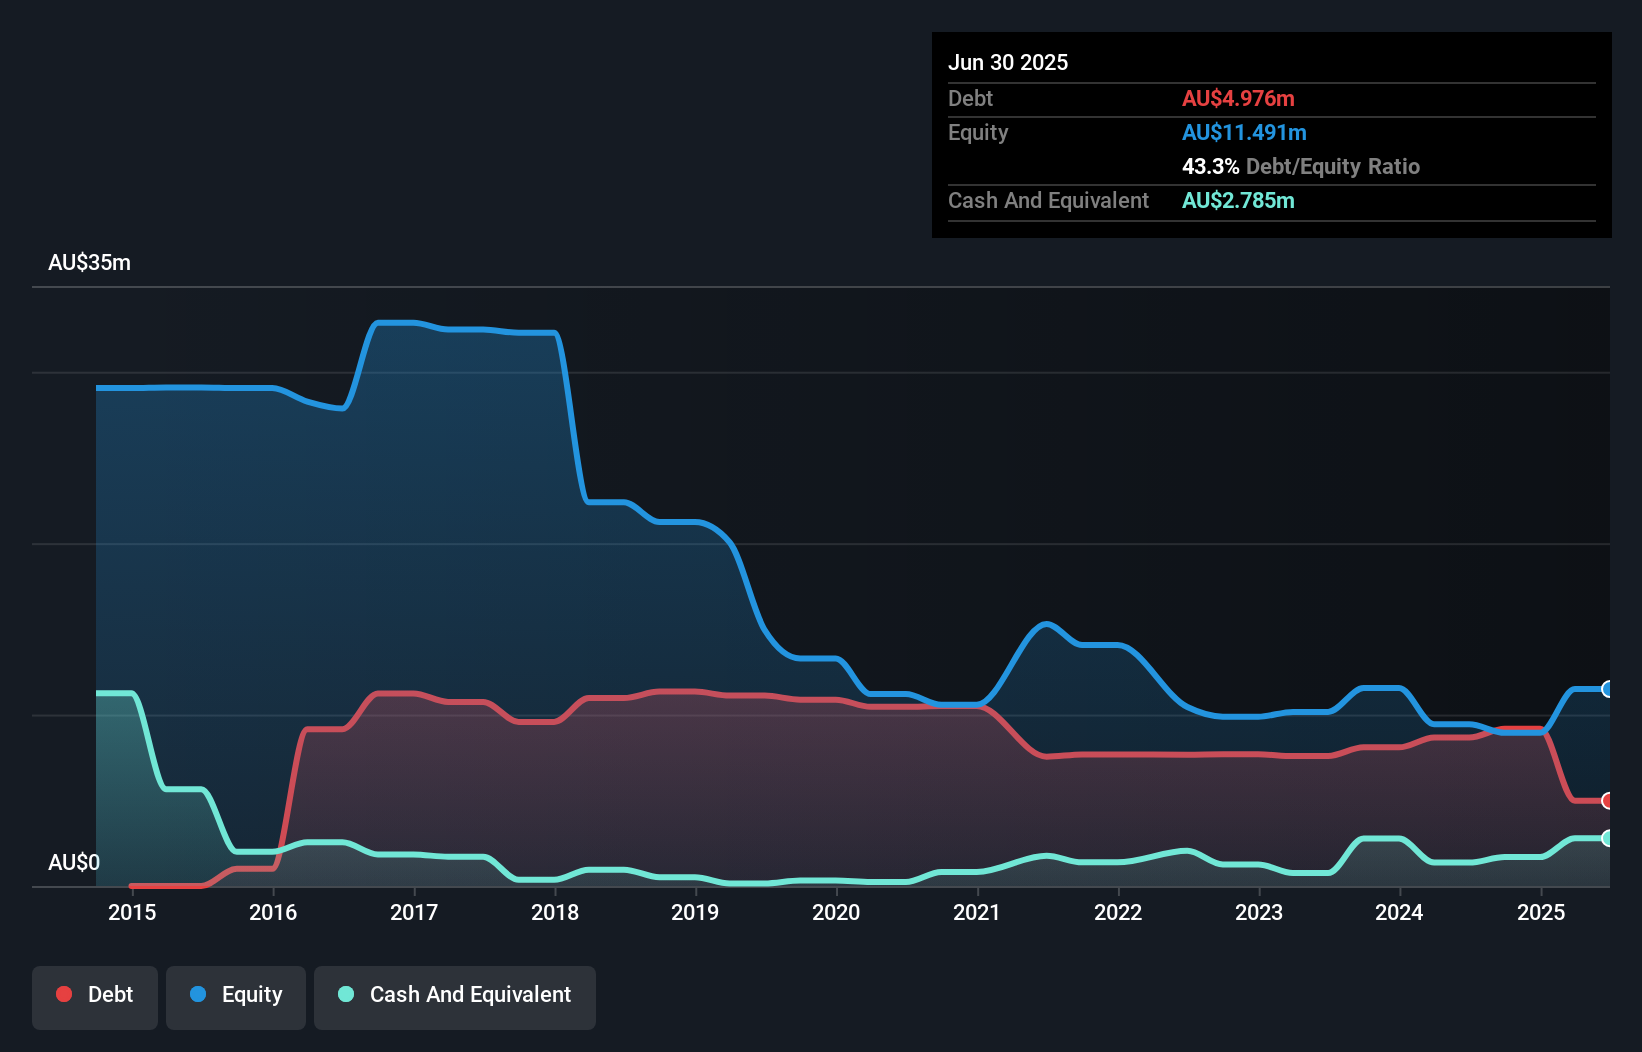
The image below, which you can click on for greater detail, shows that xReality Group had debt of AU$4.98m at the end of June 2025, a reduction from AU$8.66m over a year. On the flip side, it has AU$2.79m in cash leading to net debt of about AU$2.19m.
How Strong Is xReality Group's Balance Sheet?
We can see from the most recent balance sheet that xReality Group had liabilities of AU$10.7m falling due within a year, and liabilities of AU$23.1m due beyond that. Offsetting these obligations, it had cash of AU$2.79m as well as receivables valued at AU$2.54m due within 12 months. So it has liabilities totalling AU$28.4m more than its cash and near-term receivables, combined.
This is a mountain of leverage relative to its market capitalization of AU$35.0m. Should its lenders demand that it shore up the balance sheet, shareholders would likely face severe dilution. The balance sheet is clearly the area to focus on when you are analysing debt. But it is xReality Group's earnings that will influence how the balance sheet holds up in the future. So if you're keen to discover more about its earnings, it might be worth checking out this graph of its long term earnings trend.
View our latest analysis for xReality Group
Over 12 months, xReality Group reported revenue of AU$14m, which is a gain of 36%, although it did not report any earnings before interest and tax. With any luck the company will be able to grow its way to profitability.
Caveat Emptor
Even though xReality Group managed to grow its top line quite deftly, the cold hard truth is that it is losing money on the EBIT line. To be specific the EBIT loss came in at AU$1.4m. Considering that alongside the liabilities mentioned above does not give us much confidence that company should be using so much debt. So we think its balance sheet is a little strained, though not beyond repair. We would feel better if it turned its trailing twelve month loss of AU$3.1m into a profit. So we do think this stock is quite risky. When analysing debt levels, the balance sheet is the obvious place to start. However, not all investment risk resides within the balance sheet - far from it. These risks can be hard to spot. Every company has them, and we've spotted 4 warning signs for xReality Group (of which 2 are concerning!) you should know about.
When all is said and done, sometimes its easier to focus on companies that don't even need debt. Readers can access a list of growth stocks with zero net debt 100% free, right now.
Valuation is complex, but we're here to simplify it.
Discover if xReality Group might be undervalued or overvalued with our detailed analysis, featuring fair value estimates, potential risks, dividends, insider trades, and its financial condition.
Access Free AnalysisHave feedback on this article? Concerned about the content? Get in touch with us directly. Alternatively, email editorial-team (at) simplywallst.com.
This article by Simply Wall St is general in nature. We provide commentary based on historical data and analyst forecasts only using an unbiased methodology and our articles are not intended to be financial advice. It does not constitute a recommendation to buy or sell any stock, and does not take account of your objectives, or your financial situation. We aim to bring you long-term focused analysis driven by fundamental data. Note that our analysis may not factor in the latest price-sensitive company announcements or qualitative material. Simply Wall St has no position in any stocks mentioned.
About ASX:XRG
xReality Group
Develops and operates physical and digital simulations in the Asia Pacific and the United States.
Adequate balance sheet with slight risk.
Market Insights

Advertisement
Community Narratives
Kodiak AI - a potential 100 bagger opportunity?
Fair Value US$14.00|44.7% undervalued
DA
Community Contributor
A Fair Price for a Great Business Facing Real Threats
Fair Value US$383.06|13.0% undervalued
IM
Community Contributor
AXON And Shopify Integration Will Unlock Global Mobile Advertising
Fair Value US$646.30|0% overvalued
AN
Based on Analyst Price Targets