
Advertisement
- Australia
- /
- Consumer Services
- /
- ASX:KED
What Keypath Education International, Inc.'s (ASX:KED) 46% Share Price Gain Is Not Telling You

Despite an already strong run, Keypath Education International, Inc. (ASX:KED) shares have been powering on, with a gain of 46% in the last thirty days. Unfortunately, the gains of the last month did little to right the losses of the last year with the stock still down 30% over that time.
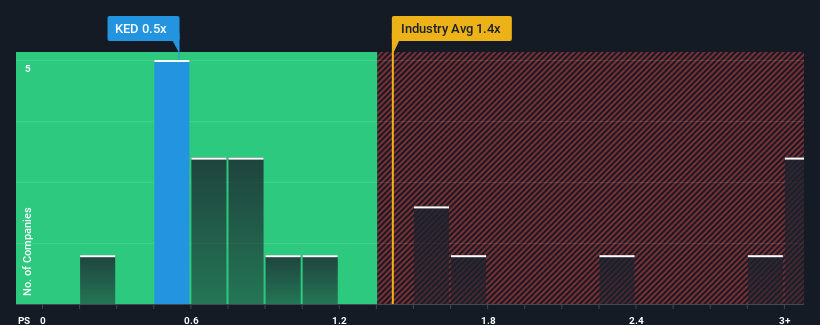
In spite of the firm bounce in price, you could still be forgiven for feeling indifferent about Keypath Education International's P/S ratio of 0.5x, since the median price-to-sales (or "P/S") ratio for the Consumer Services industry in Australia is also close to 0.8x. However, investors might be overlooking a clear opportunity or potential setback if there is no rational basis for the P/S.
See our latest analysis for Keypath Education International
What Does Keypath Education International's P/S Mean For Shareholders?
Recent times haven't been great for Keypath Education International as its revenue has been rising slower than most other companies. One possibility is that the P/S ratio is moderate because investors think this lacklustre revenue performance will turn around. You'd really hope so, otherwise you're paying a relatively elevated price for a company with this sort of growth profile.
Keen to find out how analysts think Keypath Education International's future stacks up against the industry? In that case, our free report is a great place to start.Is There Some Revenue Growth Forecasted For Keypath Education International?
There's an inherent assumption that a company should be matching the industry for P/S ratios like Keypath Education International's to be considered reasonable.
If we review the last year of revenue growth, the company posted a worthy increase of 10%. This was backed up an excellent period prior to see revenue up by 82% in total over the last three years. So we can start by confirming that the company has done a great job of growing revenues over that time.
Shifting to the future, estimates from the three analysts covering the company suggest revenue should grow by 8.1% over the next year. With the industry predicted to deliver 12% growth, the company is positioned for a weaker revenue result.
With this information, we find it interesting that Keypath Education International is trading at a fairly similar P/S compared to the industry. It seems most investors are ignoring the fairly limited growth expectations and are willing to pay up for exposure to the stock. These shareholders may be setting themselves up for future disappointment if the P/S falls to levels more in line with the growth outlook.
The Key Takeaway
Its shares have lifted substantially and now Keypath Education International's P/S is back within range of the industry median. Generally, our preference is to limit the use of the price-to-sales ratio to establishing what the market thinks about the overall health of a company.
When you consider that Keypath Education International's revenue growth estimates are fairly muted compared to the broader industry, it's easy to see why we consider it unexpected to be trading at its current P/S ratio. When we see companies with a relatively weaker revenue outlook compared to the industry, we suspect the share price is at risk of declining, sending the moderate P/S lower. This places shareholders' investments at risk and potential investors in danger of paying an unnecessary premium.
Plus, you should also learn about these 2 warning signs we've spotted with Keypath Education International (including 1 which is a bit concerning).
Of course, profitable companies with a history of great earnings growth are generally safer bets. So you may wish to see this free collection of other companies that have reasonable P/E ratios and have grown earnings strongly.
Valuation is complex, but we're here to simplify it.
Discover if Keypath Education International might be undervalued or overvalued with our detailed analysis, featuring fair value estimates, potential risks, dividends, insider trades, and its financial condition.
Access Free AnalysisHave feedback on this article? Concerned about the content? Get in touch with us directly. Alternatively, email editorial-team (at) simplywallst.com.
This article by Simply Wall St is general in nature. We provide commentary based on historical data and analyst forecasts only using an unbiased methodology and our articles are not intended to be financial advice. It does not constitute a recommendation to buy or sell any stock, and does not take account of your objectives, or your financial situation. We aim to bring you long-term focused analysis driven by fundamental data. Note that our analysis may not factor in the latest price-sensitive company announcements or qualitative material. Simply Wall St has no position in any stocks mentioned.
About ASX:KED
Keypath Education International
Designs, develops, and delivers career-relevant online education solutions in North America, the Asia-Pacific, and internationally.
Flawless balance sheet and good value.
Market Insights


Advertisement
Community Narratives
Suncorp’s Next Chapter: Insurance-Only and Ready to Grow
Fair Value AU$22.83|5.7% undervalued
RO
Community Contributor
Thyssenkrupp Nucera Will Achieve Double-Digit Profits by 2030 Boosted by Hydrogen Growth
Fair Value €14.40|31.6% undervalued
CH
Community Contributor
Tesla’s Nvidia Moment – The AI & Robotics Inflection Point
Fair Value US$384.84|21.9% undervalued
BL
Community Contributor